Editor’s Morning Note: Uber’s growth, revenue, and losses are back in the news. Here’s what you need to know.

Some analogy about winter, hoarding, fire, burn, and heat here.
Uber will close out 2016 a private company. The firm, the world’s most highly valued startup in the eyes of some, may not go public in 2017 either.
By not selling a portion of its equity on public exchanges, Uber restricts investor and employee liquidity, testing the limits of how much cash a company can raise and spend before making money, or submitting to regular financial disclosures.
However, Uber’s existence as a private company doesn’t preclude us from having windows into its occluded business model and operational results.
Recently, Uber’s performance was back in the news. Today, you and I will observe what we have known, what we know now, and who has it all backward.
What We Knew
In April, we learned that Uber was generating a modest cash profit on its North American rides. However, that minor $0.19 per ride was calculated before other corporate costs. Mattermark called its piece “That’s Not Profit,” which carried an obvious sentiment.
Still, at the time, we wrote that Uber is “a crazy neat company that is growing like a millennial brunch tab” that simply didn’t make money. At least not yet. In June, Uber indicated through a number of fogged comments that it was profitable in “hundreds of cities […] globally.”
In August, Uber retreated from the Chinese market, picking up $1 billion from its prior rival in the process. Our take was that Uber would be more prepared now to approach an IPO. After all, if it was cash profitable in the United States, and presumably dozens of global cities, why not?
A few weeks later, we learned a host of new Uber metrics, including that the company was losing money in North America again. That and its EBITDA was -$520 million in the first quarter of 2016. The number weakened by over $200 million in the second quarter.
Finally, in October, we learned that Uber was still growing very quickly in terms of rider spend. That meant more payouts for Uber drivers. Good all around, if perhaps not profitable for Uber itself.
What We Have Recently Learned
NakedCapitalism published the first of a four-part series entitled “Can Uber Ever Deliver? Part One – Understanding Uber’s Bleak Operating Economics,” which presents a base case on Uber.
Its sentiment is simple: “There is no evidence that Uber’s rapid growth is driving the rapid margin improvements achieved by other prominent tech startups as they ‘grew into profitability.” NakedCapitalism backs up that point by arguing that “If rapid growth could not drive major margin improvements between 2012 and 2016, there is no reason to believe that Uber will suddenly find billions in scale economies going forward.”
Where does the NakedCapitalism piece get its information? From a trio of public reports that we have discussed before, including two pieces from Eric Newcomer for Bloomberg, and one Amir Efrati piece for The Information. From those reports, the article creates a set of composite operating results for the ridesharing company.
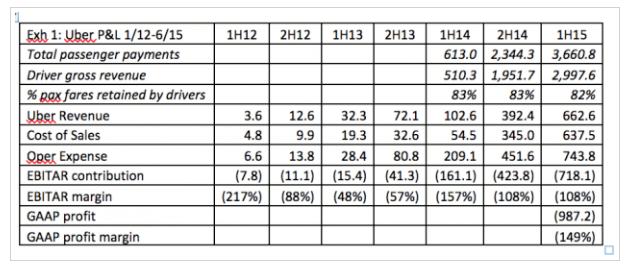
The first shows the company’s results from the first half of 2012 through the first half of 2015, excluding GAAP profit results for most periods:
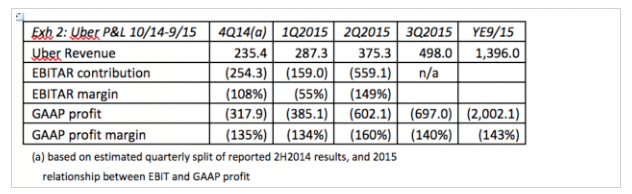
The second has a quarterly look at GAAP profit results, including margins, for four quarters, and a combined tally at the end:
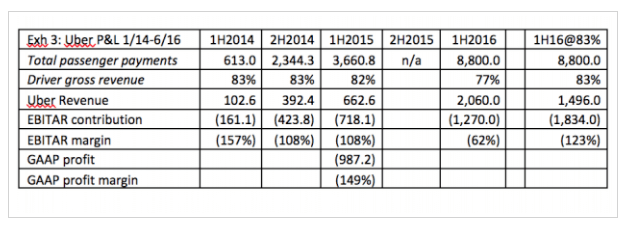
And finally, EBIT results, roughly, including the first half of 2016:
Don’t worry if your eyes have iced over. We’ll get to what matters in the charts shortly.
The rest of what you need to know from NakedCapitalism involves China:
Several of the new stories reporting Uber’s financial results quoted anonymous sources attributing a significant portion of the losses to Uber’s failed efforts in China. Uber China may have lost a lot of money but those losses are not included in (or are not material to) the losses discussed here.
However, Newcomer noted China is included in the numbers used to create the charts.
“[The] story is based on a Naked Capitalism piece which relies on/misreads my reporting,” said Newcomer. “[It] says China isn’t include[d] in 2016 H1 costs when its [sic] a big part[.]”
In short: If the now-defunct costs of China are not included in the company’s H1 costs implied in the third chart, the company is in even worse shape than we might have thought. But if Uber’s Chinese losses are included, then the company is in better shape than we might have thought.
Maybe. We’re not done yet.
What Matters?
Taking Newcomer’s side of things as its his information, we can presume Uber has seen its operating costs decline since exiting the Chinese market, making the first half of 2016 different from the second. That means any work we do given the above information is dated but useful.
Bearing that in mind, here’s what you should take away:
- From the first half of 2014 to the second, Uber nearly 4x’d passenger spend and revenue.
- The first half of 2015 was 6x bigger for driver revenue, and more than 6x for Uber’s revenue, compared to the year-ago period.
- Uber’s losses through 2015 are staggering. The company’s GAAP profit margin was comfortably worse than -100 percent.
- The company’s improving EBITAR margin improvement is in terms of percent, not raw dollars; Uber is losing more money with time, at least through the first half of 2016 (including China).
- Uber’s payout to drivers fell dramatically from a steady 8x percent to just 77 percent in the first half of 2016. That could very likely be partial impetus for the company’s improved EBITAR margin result.
I hear you. It’s Friday, and you are now gut-deep in some nerd rambling about GAAP operating margins for a six-month period two years ago. It’s not ideal.
But what matters is that there could be some truth to the complaint that Uber’s model doesn’t appear to be turning a corner, even when you discount its EBITAR margin improvement to taking a larger slice of driver revenue. That improvement isn’t sustainable long-term, as it reduces driver incentives, which harm Uber’s core supply advantage. Also, even with that change, Uber’s raw dollar losses still grew.
The Bear Case
In the third chart, there is a final column, which shows where Uber’s results would have landed if the company hadn’t reduced its payout, but instead kept it at a historically-normal 83 percent. The company’s revenue falls sharply, and its negative EBITAR margin nearly doubles.
How is such a few percentage points so bad for the company? Because the change from 82 percent to 77 percent is just five percent. But the change from 18 to 23 percent is a 27.78 percent increase.
The capitalist take here is that if Uber can take a larger cut, and its drivers will bear it, viva. What comes into question is if Uber is changing the long-term financial dynamics for its drivers. Without them, it has no business at all.
Odds and Endings
Self-driving cars aren’t going to drop into the market in time for Uber to improve its operational results before its IPO. In fact, its investments in that area could make its IPO-time results worse by forcing the company to tabulate long-term investments into R&D as short-term cash and stock costs.
Such is the life of a public company.
Uber loses more money than I would have thought, and it has done so at a faster clip than I expected for longer than I anticipated. That said, its growth is impressive. Incredibly so, really.
Here’s the question you need to answer: If Uber’s China exit lowers its operating costs, will investors cheer more the improvement of its margin results, or will they instead worry about reduced potential top line growth?
Put another way, how slowly can Uber grow while working on profitability and still go public?