Editor’s Morning Note: Notably, last year’s IPOs are still down a material chunk from their 52 week highs. Markets aren’t. What’s going on?

Earlier this week, Mattermark published a dive by Ron Miller and myself investigating how to price IPOs. As it turns out, nailing IPO pricing to the cent is essentially impossible.
In addition, Mattermark previously analyzed the 2015 and 2016 IPO groups by a few metrics, including their IPO price range estimate, their final IPO pricing, their first day close, and recent levels to gauge continuing performance. Today, we’re expanding that dataset.
Now that 2015’s tech IPOs have matured long enough to merit inclusion in plastic-bottle bourbon, it’s time to change our perspective and compare their current value to their year’s highs and lows.
Dead Splat Bounce
It’s easy to forget how horrible things were for public companies in August of 2015, and Februrary-ish of 2016. The two corrections were powder for shifting investor sentiment regarding check cadence, round size, and pre-money valuation1.
Why do those moments matter? Because during those broader market corrections, more volatile, younger stocks moved a bit more than the indices themselves. Say, recent IPOs for example.
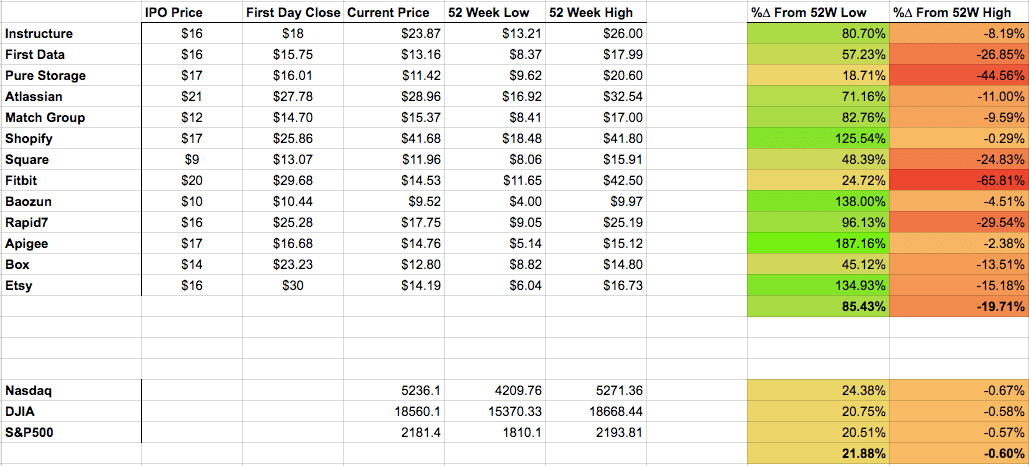
How do we know? Mostly because when we compare the average bump and drop from 52 week lows and highs for the 2015 IPO cadre, the shifts are far, far greater than the various markets’ own changes.
We would always expect a smaller basket of securities to be more volatile than an index, but, check the following:
Larger version here. Data via Google Finance.
Quickly, the 2015 crop is up strongly from its 52 week lows, but remains a full fifth under its highs. If the public markets are a mote from all-time highs2 and our fine companies are not, we are seeing misaligned peaks. Or, the IPO kids hit record highs before the large American indices.
You can see what appears to be two lessons in the above. First, that the public market dramatically undervalued the companies listed above when it was afraid. Against that, all those firms are still public and have recovered nicely. Second, the market also managed over-enthusiasm inside of the same year; being down a fifth isn’t a joke.
(You can handicap if the negative delta from 52 week highs for the 2015 group is either the accretion of regret regarding prior overly positive sentiment, or a nice reality check that the Nasdaq has yet to come to terms with. It depends on your own mood.)
Regardless, after some thought it’s staggering how far back 2015’s IPOs have come. If they had stayed down as far as they were, I doubt we would have even seen the meager IPO crop that we have so far this year.
The result of all that green is persistent rumors that starting in September things are going to kick into high-gear on the S-1 front. We’ll see.
- Yes, and post-money implicitly as we are discussing pre-money valuation and check size, but don’t be such a pedant on Friday! That’s my job.
- 52 week highs for markets at the moment mostly are all-time highs. Welcome to 2016’s odd data-stew-milieu.