tl;dr: Venture investment into US-based companies weakened in the third quarter, with total rounds and dollars disbursed falling on both a sequential quarter and year-over-year basis.

So close, yet also so Q3 VC.
The third quarter is over. It brought with it some much-anticipated late-stage liquidity in the form of both acquisition volume and initial public offerings. Liquidity aside, however, how did venture activity stack up in the quarter?
Following our second and first quarter reports for 2016, we’re taking a similar look at the period today.
And echoing our recent work, this piece is not an effort to bring you every data point that we might have. Instead, we want to provide you with the raw information and directional notes that may prove actionable.
We’ll start big, dive into sectional analysis, and then discuss year-to-date results.
Q3 VC Activity Falls
As with prior reports, Mattermark sorts the quarter’s funding results down from the full sift into just deals executed into United States-based companies, excluding private equity and rounds that don’t fit into the Seed to through Series H set. Those reductive steps provide a slightly conservative set of results, our preference.
Those guidelines in place, here are the key results:
- Q3 2016 Venture Rounds: 590
- Q3 2016 Dollars Invested: $8.18 billion
In comparison, here are the results from the sequentially preceding quarter:
- Q2 2016 Venture Rounds: 754
- Q2 2016 Dollars Invested: $9.88 billion
And the year-ago quarter:
- Q3 2015 Venture Rounds: 854
- Q3 2015 Dollars Invested: $13.41 billion
For you math kids, here the numbers you have been waiting for:
- Percent decline in rounds from Q2 2016 to Q3 2016: 22 percent
- Percent decline in rounds from Q3 2015 to Q3 2016: 31 percent
- Percent decline in dollars invested from Q2 2016 to Q3 2016: 17 percent
- Percent decline in dollars invested from Q3 2015 to Q3 2016: 29 percent
This means that, in terms of both dollar volume and round volume, the third quarter of this year was worse than the immediately preceding second quarter, and the year-ago comparable.
That implies that the third quarter climate for startups raising capital has both gotten worse on both a short, and medium-term timeframe. Not great news for the fundraising founder.
Two Bright Spots
Amidst the gloom of comparing the aggregate quarter to two other, better quarters, let’s find a smile before we proceed.
If you slice the third quarter up by Series, and then compare each traunch, you get a number of comparative results. Late stage capital in Q3 2016 against late stage capital in Q3 2015, or Series B round volume in Q3 2016 versus Q2 2016, for example.
Among all the possible quarter and volume pairs, just two have positive results. So, let’s take a moment to enjoy them:
- The number of Seed rounds in Q3 2016 beat the Q2 figure from the same year by nearly 9 percent.
- The amount of Series B capital invested in Q3 2016 was 207 percent greater than the Q3 2015 result.
That’s it. Everything else was down. How far down? We can tell you.
Series By Series
Looking at the entire quarter as a whole is useful as it can smooth out some divergent results that can cloud our view of the venture industry’s performance.
But there is value as well in per-Series perspectives as well. So, to that end, what follows are the percent declines on a round basis: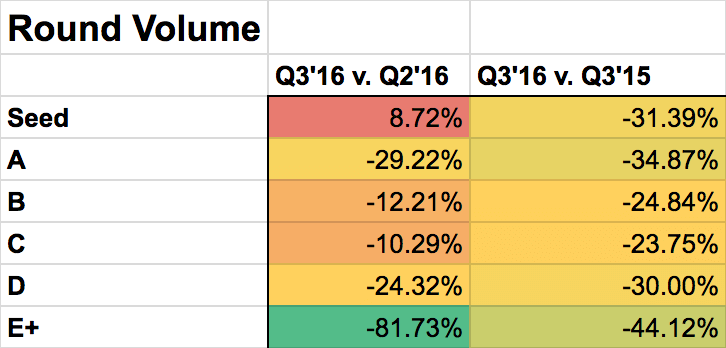 And on a dollar basis:
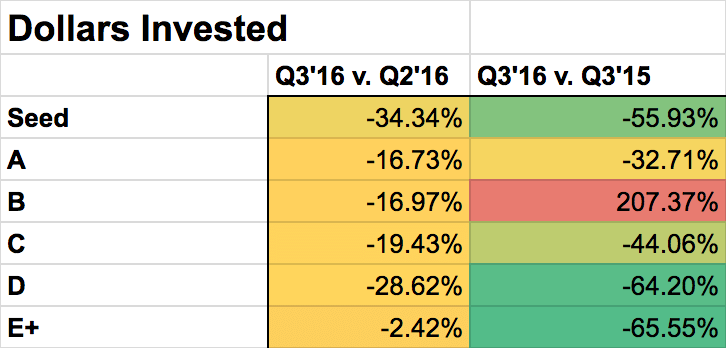
That is a sea of negative ink. If you keep in mind that cooler colors (leaning towards green) are bad, and warmer colors (trending towards red) are good, you can see that there is very little to get excited about.
Also, you can see both our bright spots. They are the two red boxes.
This begs the question: Did we expect the third quarter to be this weak? Were there signs along the way that served as warnings? Yes, of course.
The Shockingly Recent Past
Aside from two warnings posts from Mattermark during the third quarter, it’s worth rewinding back to our work on the second quarter.
Summing both the quarter and the conclusion of the first half of the year left us with the following notes at the time:
Things were sliding into the third quarter in a nearly linear fashion, making where this quarter wound up not entirely surprising.
If you will allow a small victory lap, Mattermark’s CEO Danielle Morrill wrote something in the middle of Q2 that’s worth recalling. The following headline summarizes internal sentiment regarding the current venture market, from that point through to today:
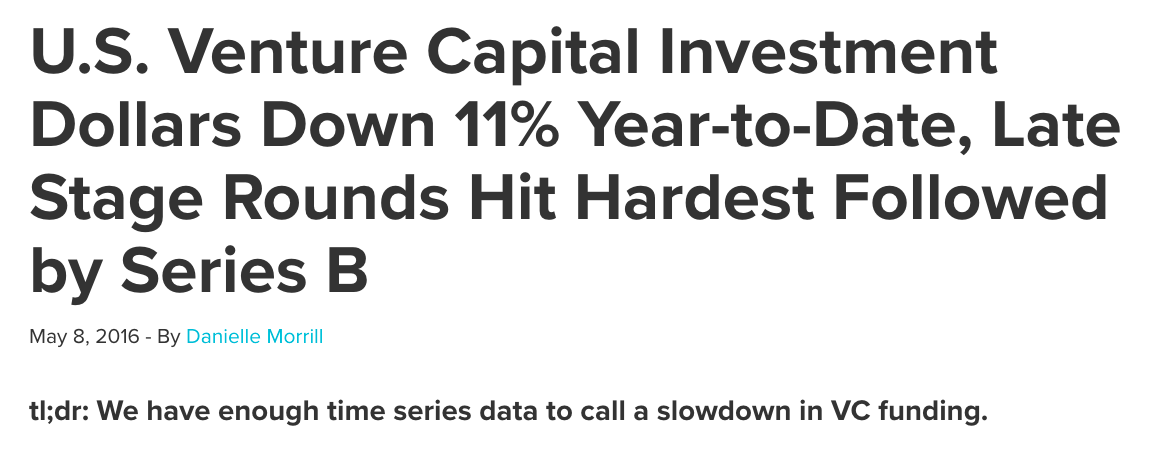
We did, and it bore out over the past four of five months.
Mattermark And Friends
But don’t just take our word for it. Every venture datasource has its own biases regarding when things are counted — round timing, what counts, the inclusion or exclusion of private equity, etc. To make things even fairer for you and yours, today we’re going to chart out an average of a few datasets through the third quarter of this year.
Notes first, however. Pitchbook recently started to provide the NVCA’s regular venture data, meaning that the group no longer depends on PWC data. Before, NVCA-PWC data was separate from Pitchbook data in our notes, so our averaged set of data looked, well, different. This quarter, Mattermark and Pitchbook-NVCA are first out of the gate, meaning that we only have two data sources to average for the period.
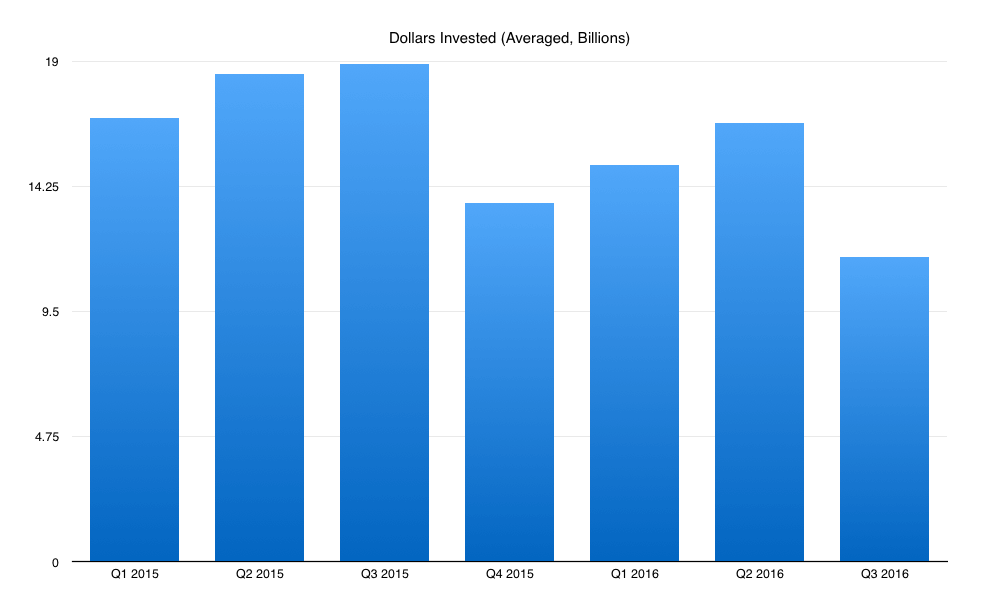
All that aside, what follows is our past dataset with a new column added to represent our growing third quarter result. First up, dollars invested:
And rounds per quarter:
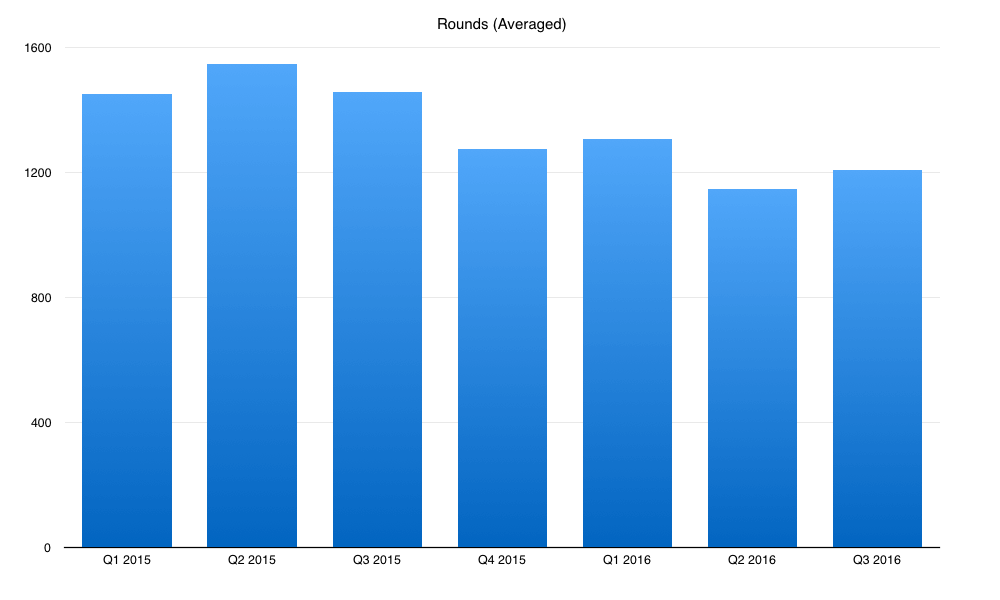
As you can see, when you combine the Mattermark and rival data, things look slightly rosier on the rounds side of things. It gives us a one-fourth positive result. To sum using our averaged dataset:
- Rounds down, year-over-year.
- Rounds up, sequential-quarter.
- Dollars down, year-over-year.
- Dollars down, sequential quarter.
Not wildly better.
—
We’ll take shorter, deeper looks at aggregate year-to-date results later, and we will also take a peek at the amount of money that venture kids themselves raised, but to cap off this section of our thinking recall what we published yesterday: A look at September in historical context.
That short entry noted that September, the final quarter of the month, didn’t look strong. If that is any sort of predictor, we could be looking at a weak start to Q4.
Welp.