tl;dr: It turns out that the massive repricing of recurring revenue got us all the way back to normal. Wee!
The new ride at LP Fun Park was not a hit.
Heading into earnings season, it’s important to keep an eye on what things are worth. Revenue, for example.
Twice this year, we have looked at the changing value of recurring revenue—a substance most often referred to by its yearly result. Thus the term “annual recurring revenue” or ARR.
Today, we’re taking a third and penultimate look at the value of ARR. During our third crack at the question, we are turning back the clock to a simpler time for some historical bearing.
The Ancient Past
First, let’s quickly hone our definition and understand why ARR matters. After all, ARR is non-GAAP; therefore, it must be treated as the houseguest that may steal the spoons.
ARR estimates a company’s forward revenue by taking its most recent quarter’s recurring revenue total and multiplying it by four1. For example, if you had four customers on contract to pay $10 each quarter, your ARR would total $160 at the end of the current period.
Startups are often valued at a multiple of their ARR. This helps investors and founders alike parse how much revenue the company can expect without growth and how much revenue they might expect given a certain growth rate. Both calculations use a functional revenue projection foundation—ARR—because recurring incomes are more consistent than other revenues (in theory) and are thus easier to model.
Simple enough. Now, what is a dollar of ARR worth? Here’s a notable set of estimates from Union Square’s Fred Wilson, written in 20112:
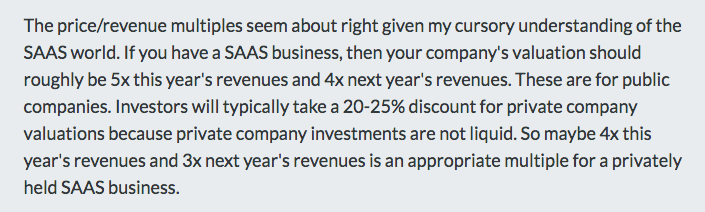
There are two key things to note in that paragraph:
- Wilson gives us two valuation bands.
- He states that private valuations should be more conservative than public valuations given that they are less liquid.
What matters is that Wilson sets historical benchmarks for what is fair. However, we have to be careful with this benchmark. Wilson appears to count all revenues in his calculations, and he also uses full-year trailing revenue instead of ARR to write out his ratios. Sanding off the rough edges of potentially mixed revenue and imperfect analogies, Wilson was willing to pay between three and four times private SaaS companies’ ARR in 2011, and a bit more for public SaaS companies at the same time.
Lesson: If you are using public analogs to value your company and not taking a liquidity discount, you are likely skiing a bit ahead of your skill level.
The Recent Past And Mostly Present
Why do we care about a piece of anecdata from 2011? Because it provides the context needed to understand where we are today.
In our first piece discussing the value of ARR, an ARR-to-valuation multiple of 3.3 was the new low. That figure had fallen from a ratio of 7.7 to 1, making the 3.3 figure remarkably small; when anything loses more than half its value, it’s notable.
Our second piece found that the same metric had risen to a multiple of 3.7, but that didn’t get us to understanding where things should stand. Yes, the value of ARR had rebounded a bit, but which was more akin to normal: its floor or its ceiling?
The floor, it turns out. Keep in mind that Wilson was willing to pay around four times the forward revenue of public SaaS company. Discounting that figure as conservative given that forward revenue should be larger than ARR—this ∆ grows the more quickly a company grows3—we can snag Wilson’s upper end and call doodle up a five times ARR multiple for public SaaS companies.
Speaking simply, 5 is closer to 3.7 than 7.7. And the last time we checked public SaaS multiples we were moving modestly back towards normalcy.
So What
Why do we care about the arcana of revenue multiples? Because it determines who pays the brunch tab.
For example, if your friend’s company raises a Series A round at an up valuation, they are going to pay for the brunch tip. But if their company later has to raise a flat or down Series B, expect to handle your own gratuity.
That friend’s company may in fact have grown well, used cash responsibly, hit its benchmarks, and still lost ground on its valuation. Why? If the market reprices ARR more quickly than a company can expand its own recurring incomes, it moves backwards.
It’s brutal. Companies that might have correctly expected a certain valuation can run into things like the following and end up not sleeping for a week:
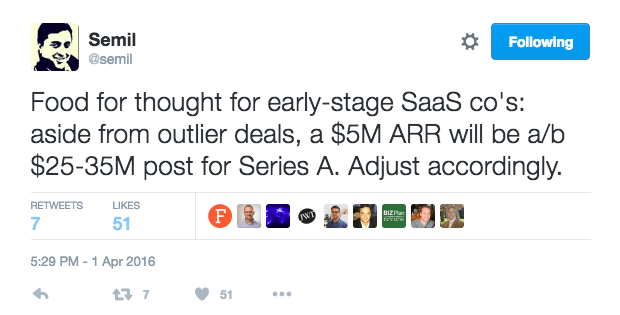
Those figures work out to $20 and $30 million pre-money valuations, which is a fun way to compare end-of-last-round value to current-round-accreted-value. You can suss out the implied ARR ratios yourself and compare them to Wilson’s prior notes.
There’s lots of flexibility in the above, but we can gist out a few concepts that are useful:
- The value of ARR among public companies has fallen from its 2014 highs.
- VCs are more stingy about what they are willing to pay for ARR than they were before.
- That’s not surprising given that the public market itself has dramatically changed the value of ARR, something that percolates back into the private markets.
- The correction we have seen is more a reversion to the norm than a new reality.
- The good times were good, but unless dramatic upside is found in public equities, the ARR-valuation ratio will not improve much in the next year or so.
So welcome back to where we were, mostly: conservative valuations are back in vogue but not at record lows.
What will be most interesting is the long-term value premium that ARR can command over regular, non-recurring revenue. If it cannot, then many companies that were valued on the presumption of that value premium will be in for a rude discount.
—
- You can also your last month’s recurring revenue and multiply it by 12; the longer the sample size you use the more conservative the ARR estimate. Quarterly is a fine compromise.
- 2011 was 19.8 years ago in Technology Time, something to keep in mind.
- Today’s homework: Can you explain why this is the case in a tweet or less?