Editor’s Morning Note: Welcome to the tail-end of earnings season.

Shares in Square are up more than 12 percent today, following a strong earnings report that sent the value of the payment processor soaring.
Why? A fine question.
Square is a fun company to quickly dissect because its moving parts are easy to understand. Today, you and I are going to drill into the charts and see why Square finally had the quarter it needed.
Raw Numbers
TechCrunch’s Matthew Lynley dd a capital job explaining the core performance of Square’s second quarter. We’ll lean on that to start:
Square brought in more revenue than expected, lost less money than expected, and saw a key secondary revenue line more than double in the last year. All told, a solid set of numbers.
The company wrapped the quarter with $423 million in cash, down slightly from the year-ago period, but still a deep reserve compared to its current pace of losses; given its improving ramp to profitability, Square likely won’t need the full sum for operational deficits. You can place separate M&A bets on your own time.
Square also posted guidance that was deemed fit by investors.
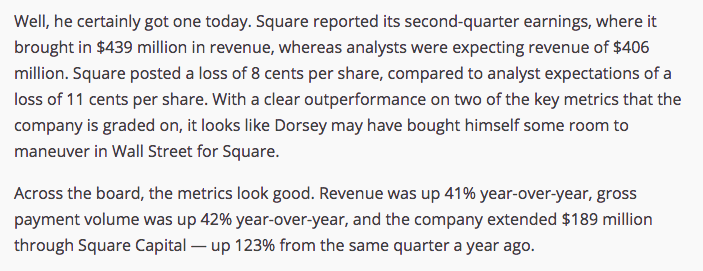
Profits, Real And Adjusted
Something that I do like about Square is that it is currently judged according to its GAAP earnings per share. That’s to say that the $0.08 per-share loss it posted in the second quarter is not built on adjusted profit metrics.
That means less bullshit, and more reality.
Technology companies are fond of adjusted metrics for obvious reasons. They are the hairpiece of earnings. If you don’t look closely enough, well, you might just think something different.
However, Square is vetted on GAAP earnings, which means that the following chart is interesting:
In Common Dork, that spells something winsome.
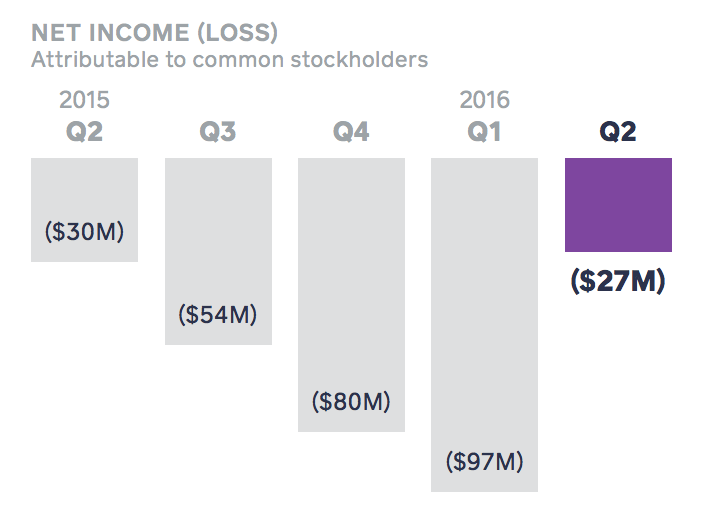
However, the above chart is not the full story. We have to grant Square the chance to show off its adjusted metrics, because they can provide another useful lens we can use to vet performance:
That’s a bit nicer. What matters more than the year-over-year performance is the scale of the improvement from the third quarter’s bottom o the top of the second quarter’s peak. That’s a 2,000 basis point movement in under a year. When it comes to margin expansion that’s catnip.
Caveats are obvious. Given that the year-ago second quarter was stronger than the ensuing few, I have no expectation that the current year won’t have a similar trend. However, starting with around seven times the initial adjusted profit margin will likely grant Square more room to get its ensuing quarter closer to the GAAP profit threshold.
The Startup Comparison
It’s consistently notable to me how the scores we use to vet startups change so dramatically after their IPO. For two reasons, I think. The first is that we the public can get our hands into the legally-mandated disclosures that grant us a window into the newly public company. And second that companies that go public are often more mature and therefore ready for a more vigorous vetting on wider swath of metrics.
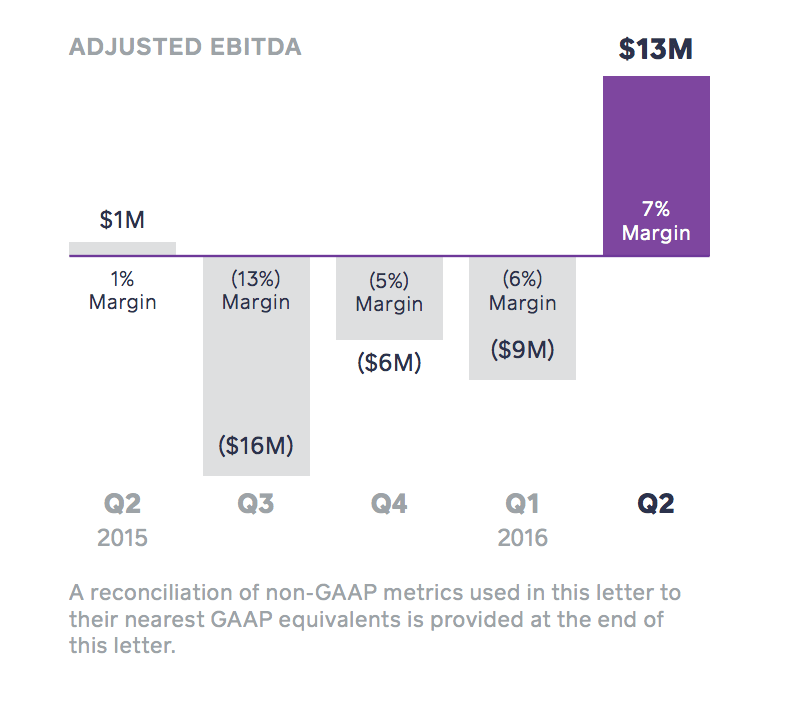
Fair enough, and all that. However, if Square had, instead of going public, raised another few hundred million from the private markets, likely the only data that we would have to vet Square’s health would have been a hearsay edition of this, from its most recent earnings missive:
That’s as top-of-the-funnel as it gets for Square, in terms of its financial performance. From that chart comes net revenue, and then operational expenses and so forth until we hit GAAP profits and end-of-quarter cash position changes.
The point is that neither of us thought a more in-depth wander through Square’s operational results wasn’t worth our time. But, both of us would have been content to blithely say “Square’s doing fine” if we had heard from a strong source that it was still growing its gross payment volume by more than 40 percent each quarter, and nothing more.
Something to think on.