Editor’s Morning Note: Give me your hand, we’re charting VC back to before Metallica was born.

Later today, Mattermark will publish a look at historical venture capital patterns in the United States, answering the questions where in the country have most dollars been invested, and where in the country have the most checks been written going back a full decade.
Before, however, I want to rewind even further.
When we discuss the modern world of startups we take for granted how much it has grown, perhaps especially from the financial perspective. To that end, Fortune’s Kia Kokalitcheva recently published an interesting historical detail concerning the venture industry:
Kokalitcheva’s source for the data is this “excellent overview of the decade,” to use her words. If the number of firms more than doubled from 1980 to 1983, the relevant charts must be interesting.
Let’s draw something together.
The Ancient Past
As it happens, I have a number of old National Venture Capital Association and Venture Economics reports on my desk that go back pretty far in time.
If you were alive in 1978, well done.
Compiling from two different entries including the 1995 edition, and the 1991 iteration, I graphed the datasets concerning venture capital fundraising activity over time. The following chart shifts colors when the source report changes:
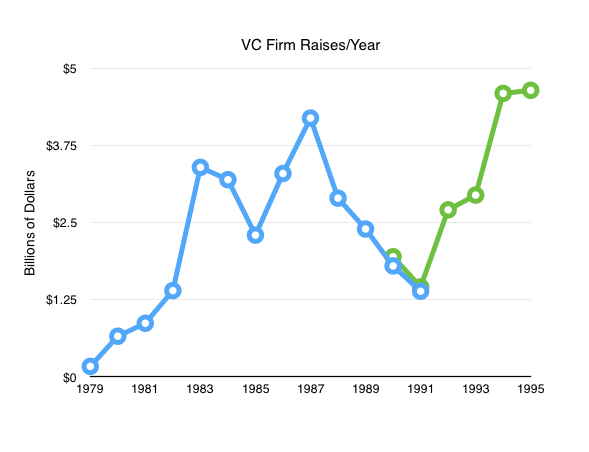
(Later reports presenting higher aggregate venture sums for the past isn’t odd. So, to see the green line sit slightly above the blue is what we would expect.)
We can correlate the growing scale of funds raised by venture capitalists to the change that Kokalitcheva cited, which also led to the creation of a quickly growing number of venture funds. From her source, observe the following chart tracking fund creation — it correlates neatly to the blue line in our chart:
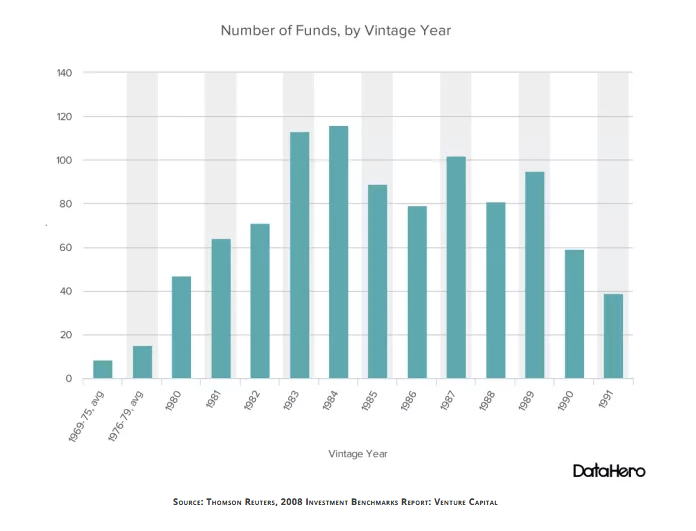
Shockingly, there is a correlation between aggregate venture raises and the number of funds created.
All this isn’t to restate relatively well-tread history. Instead, bear the above numbers in mind when the third quarter venture raise figure comes out. There has been more than $20 billion raised to date in 2016.
That’s around the same amount as the first half of the ’90s, in only half a year.
Ah.