tl;dr: If I didn’t pay my rent, I too could be profitable.

According to a recent Bloomberg story, Uber earns an average of $0.19 per ride in North America when taking into account most costs associated with that revenue. However, in that average certain expenses are discounted, including “interest, taxes, [and] equity-based compensation for employees.”
It’s heartening to see Uber improve its unit economics in a key market. The progress points towards the company’s model having long-term legs; what it accomplishes here can likely be translated to less-mature markets where the company continues to spend heavily on growth and marketshare.
But is Uber profitable in North America? No. Let’s take a look.
I Dislike That Cost, Please Discount It
Normal accounting methods, often referred to as GAAP, or Generally Accepted Accounting Principles, don’t allow companies to exclude costs when calculating profit. Public companies must report their results using GAAP methods.
Startups, however, often report their results on a cash-focused basis to their investors as it can be a more useful lens. Public companies may also present adjusted metrics in addition to their GAAP results.
The $0.19 figure likely shows how rides in North America are now better than breakeven when calculated against direct cash costs associated with the average ride. That’s useful, but not a measure of real profitability. On a GAAP basis, when all costs are taken into account, I doubt the margins are still positive.
To understand that point, let’s focus on just one of the costs that Uber is discounting: share-based compensation. Share-based compensation is when employees are partially remunerated in equity, and not completely with a cash salary.
When share-based compensation is discounted, the difference between GAAP results and adjusted incomes can be staggering to the point of humor. Twitter, for example, published this at the end of 2015:
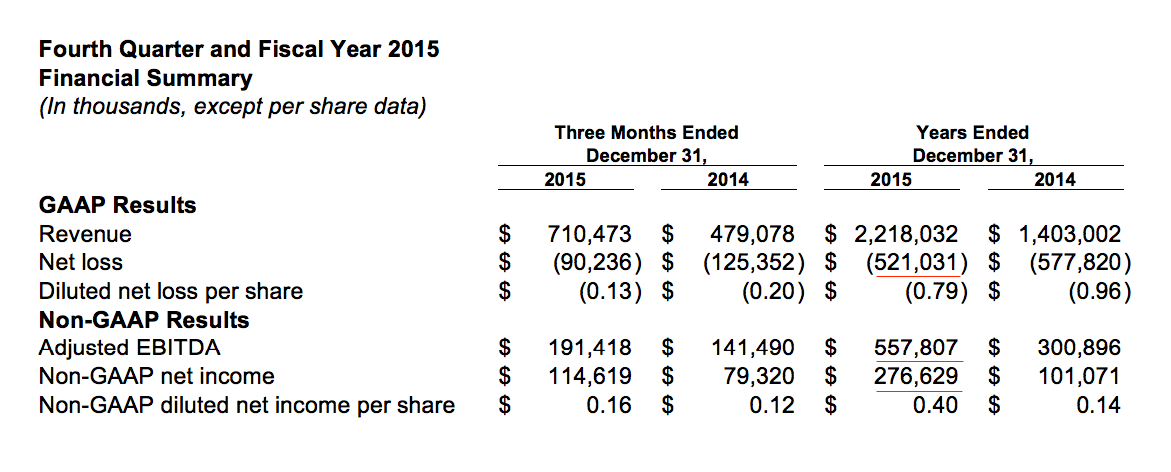
The first underlined figure is Twitter’s GAAP net loss in 2015. The second line is Twitter’s adjusted earnings before interest, tax, depreciation and amortization. The final figure is its adjusted net income, a stricter metric. You’ll note that the company’s net loss is huge, its non-GAAP net income large, and its adjusted EBITDA staggering.
So, you can move numbers around based on how you count costs. What is driving the massive difference in Twitter’s various profit metrics? In 2015 it spent $679 million on share-based compensation. Twitter is an outlier when it comes to the percent of its revenue as a ratio it pays out in share-based compensation, but you can see how the expense can hurt under a GAAP accounting.
I presume that Uber’s discounted costs in North America sum to more than $0.19 per ride.
None of this is to say that Uber isn’t a crazy neat company that is growing like a millennial brunch tab. But if people start trying to tell you that Uber is profitable in its home market, just whisper GAAP in their ear.