Since launching Mattermark in June of last year, we’ve included a number called the “Mattermark Score” which started out as a design solution to an important design problem: how to present the default sorted list of companies on our first page. Much like in search engine results, we knew it would be crucial for the first page of results to be interesting and useful, but not merely the usual suspects.
Inspired by Paul Graham’s essay “Startups = Growth” I took the signals we had at the time and concocted a crude score methodology to capture the week-over-week and moving average changes of things like web traffic, mobile downloads, inbound links (similar to Google’s BackRub), Twitter followers, Facebook page likes, and LinkedIn company page followers. The score is crude because it is simplistic, weighting each signal equally and then assigning a coffecient for web traffic so that a company like Twitter would still get credit for growing 1%, while some tiny no name site wouldn’t be overly credited for growing from 400 to 4,000 uniques in the course of a month.
As a founder, this score is interesting because we all know if we don’t get our products in the hands of real people and get them talking about us we don’t have much of a shot of crossing the chasm into the mainstream. While the volume of people at the top of the funnel is different for B2B vs. B2C startups, the fundamental idea is the same. I also wanted to create a score that wouldn’t be overly influenced by short term spikes like those driven by PR events. Instead, the score gives a greater reward to consistent growth over time.
When it comes to how investors evaluate startups, much has been written about the 3 most important factors: team, market, and traction.
When it comes to how CEOs evaluate how well we’re doing, much has been written about building the right product, hiring the right people, and making sure there is money in the bank.
Lately I’ve been pondering how to bring more of the hiring and money in the bank piece into the equation, to see if it yields a *better* default sort. Better in this context is subjective, but there is definitely something to be said for meeting a user’s expectations in their first impression.
Current Top Companies in Mattermark – Sorted by Mattermark Score
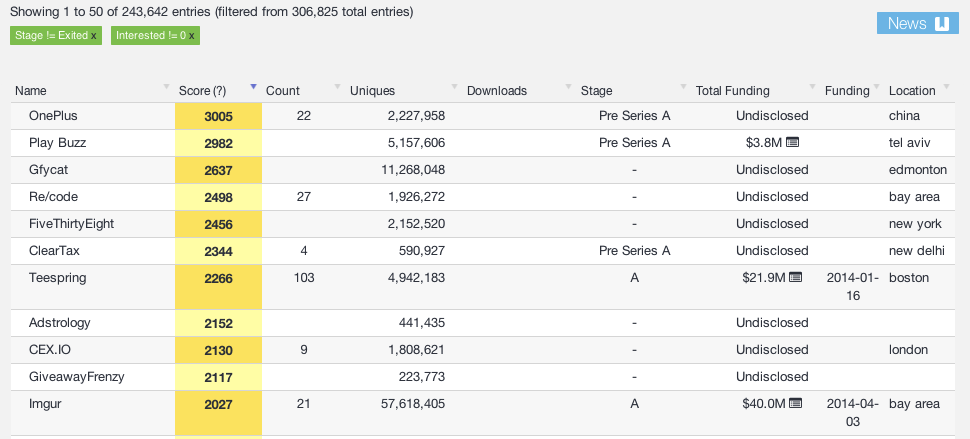
While this definitely does reveal some companies that are seeing pretty incredible growth, it is not actually clear that all of them are startups. The risk of having a default list like this is that investors won’t see something they recognize, and will start to wonder about the utility of the entire tool… whether that’s fair or not.
Now let’s add a few more columns touching on most recent funding and employee count change since that event, to get a sense of who has been most successful putting the capital they raised to work to build a team. Because we track employee count as time series data, we can understand how increased employee count fits into the funding and growth timeline
Top Companies in Mattermark – Sorted by Mattermark Score, Filtered by Minimum 1 Employee Added Since Last Funding Round
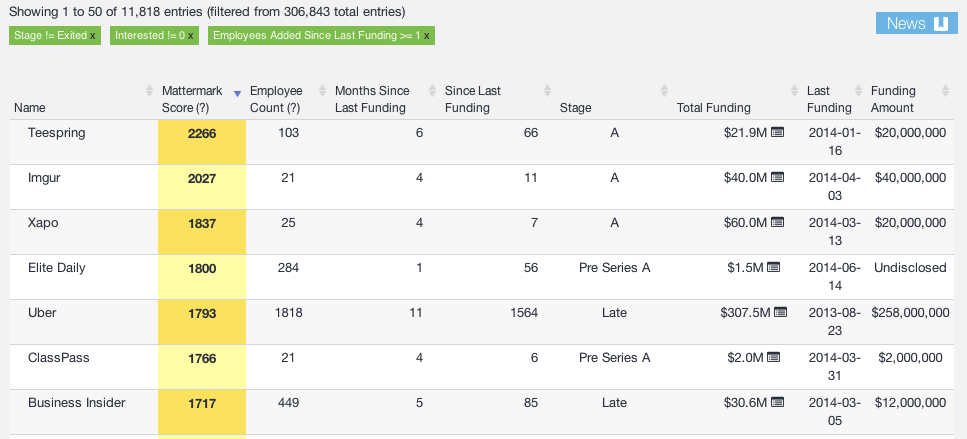
The startups on this list are definitely more recognizable at a glance, and a quick check suggests this is closer to passing the subjective sniff test. However, it is still ordered entirely by the Mattermark Score so there are definitely some companies in here who aren’t getting nearly enough credit for massive hiring efforts. Hiring is interesting beyond operational efficiency, being able to hire a lot of people can also indicate healthy unit economics.
Now let’s just try something simplistic. What if we export a list all companies who have raised in the past year, get their Mattermark Score and multiply it by the number of employees hired since the last funding round took place and then divide that by the number of months since the last round was announced.
Here’s what the top 100 tech companies look like. If you want to dig deeper you can create your own Mattermark trial free for 30 days, and get your hands on all the underlying data like historical employee counts, round, and more than 50 other signals measured weekly for each of the 300,000 companies we track.
Purchase the full analysis of 3,874 companies ranked using this methodology (the spreadsheet below, but not cut off at 100 companies) for $999 through our data store. BUY NOW