tl;dr: We found out just how many startups raise (or don’t raise) their next round.

Series F rounds are as rare as employed philosophy majors.
We had a burning question: What’s the matriculation rate of startups from round to round?
In other words, if 100 startups raise a Seed round, how many of those will go on to raise a Series A, and then a Series B?
Out of the hundreds or thousands of companies that raise Seed rounds in a given year, that cohort is going to be whittled down to a few dozen by the time we start talking about, say, Series E, F, and beyond.
We wanted to know how steep that drop-off rate is. So we figured it out.
Finding Startup Matriculation Rates
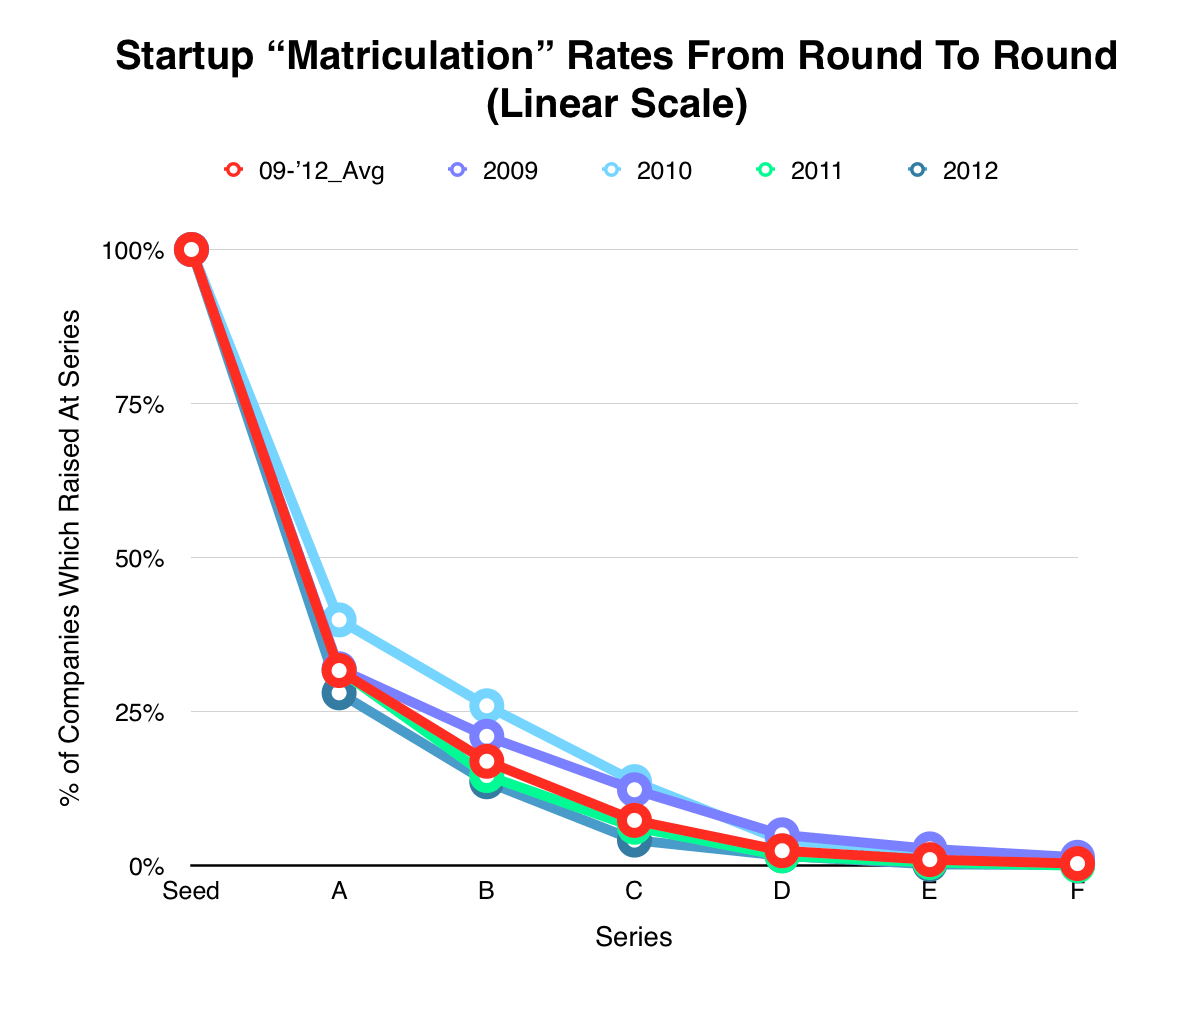
Back to our question about the 100 Seed-stage startups, how many will go on to raise a Series A? On average, around 31 of them will. From there, the number of startups that raise a Series B halves and continues to halve in a stepwise function through Series F and beyond.
As we can see, the drop-off rate is pretty steep.
Source: Mattermark data.
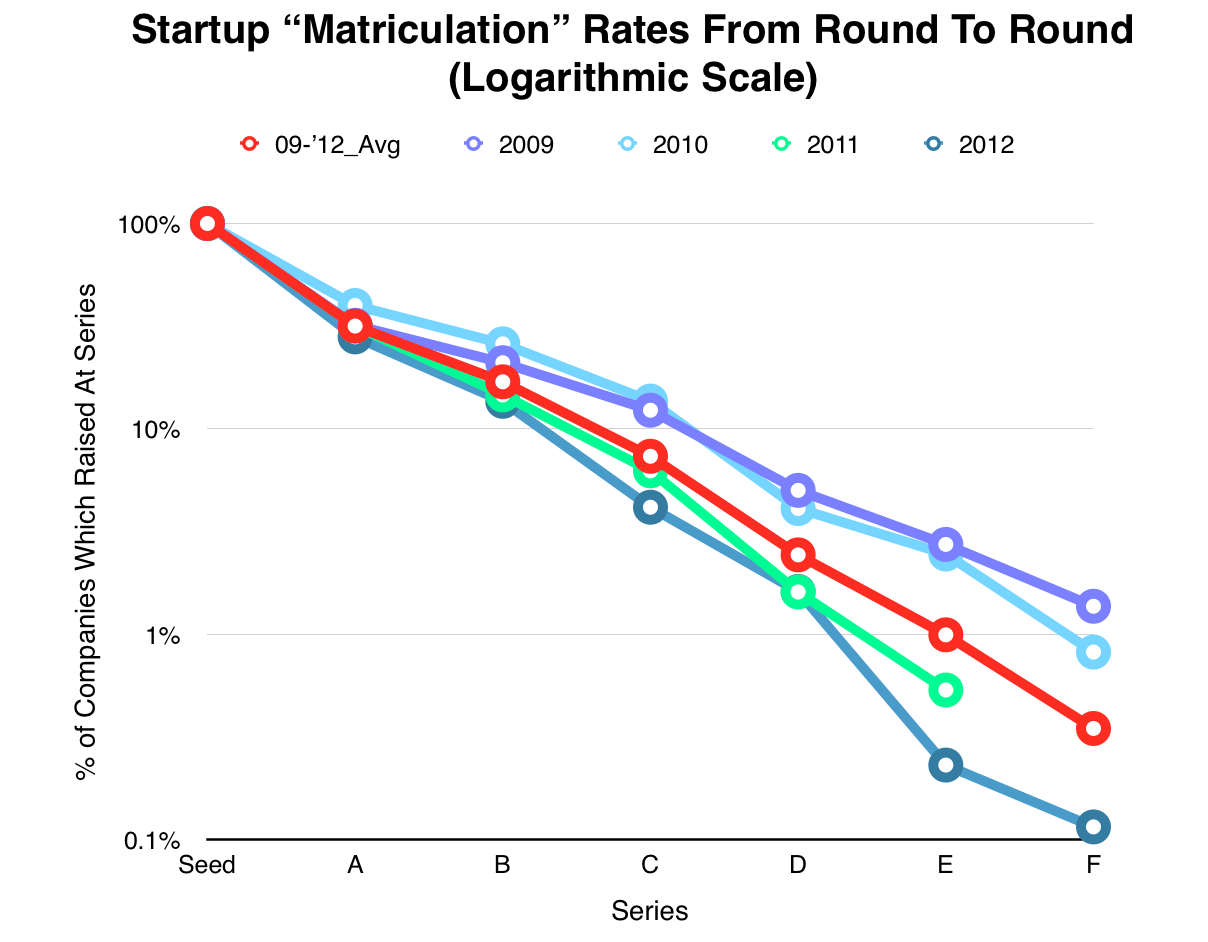
Displaying the data in a slightly different way, we can see that the trend lines on a logarithmic scale are almost perfectly straight, indicating exponential decay. (You might notice that the 2011 cohort is missing a data point for Series F rounds. That’s because none of the startups in that cohort raised a Series F, as we’ll show in a table below.)
Source: Mattermark data.
How We Figured the Numbers
How did we find this out? We took a look at 2,011 US-based software companies that raised Seed rounds between January 1, 2009 and December 31, 2012. We chose the time period because it is long enough for the constituent companies to have set their own trajectory, and close enough to today that the findings are actionable for founders.
For companies that raised their Seed rounds in 2011 and 2012, the drop-off rate is likely steeper, at least in part, because those cohorts had less time to mature, reducing the rate at which they raise later stage rounds.
For these companies, we took the series of the last round they raised and recorded that as the “terminal stage” of the startup. Then, it was a simple matter of segmenting the data by the year in which the company raised its Seed round, tracing the trajectories of the startups in each “batch,” and converting everything to percentages for easier comparison. We also took an average of all four years’ worth of data to balance out any outliers.
By design, the result of this analysis are going to be a bit more conservative. There’s a chance that the matriculation rate is a bit higher, but it’s likely not any lower than what we’ve found.
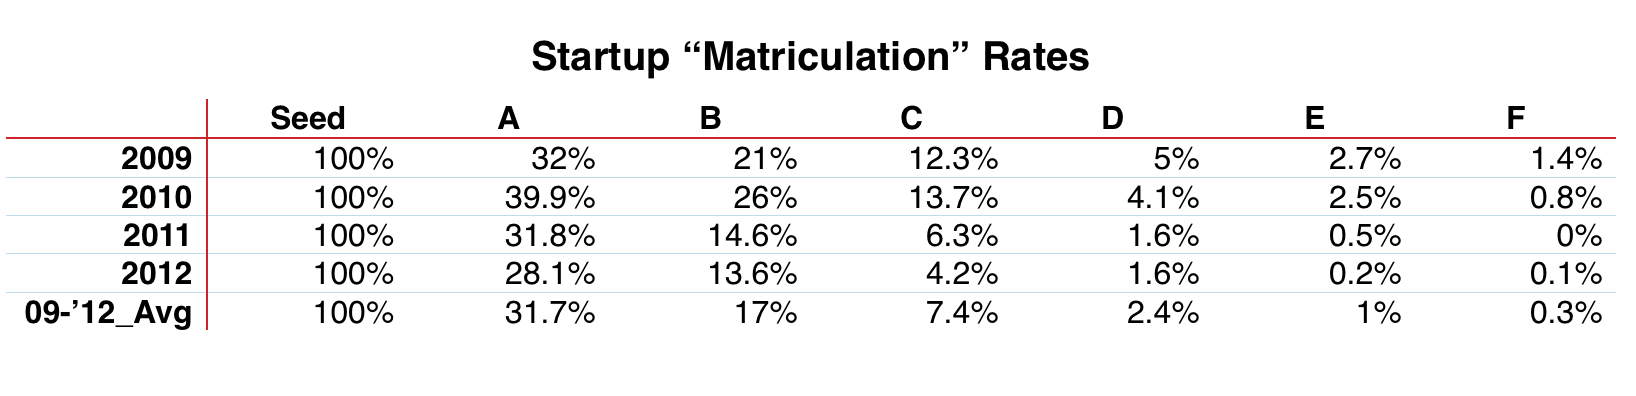
Here’s the data in table form.
Why The Drop-Off?
Startups may “fail” to raise another round for many different reasons. There are three main reasons that are fairly straightforward:
- The company fails due to running out of money, the team breaking up, or other reasons.
- The company reaches financial sustainability and doesn’t need to raise another round of capital.
- The company is acquired.
There’s no way to tell for sure, but we hypothesize that running out of money, team breakups, and other factors are the primary reason for the precipitous drop-off between Seed and Series A, whereas acquisitions and reaching financial sustainability are larger drivers of the more steady declines in matriculation after Series A.
There is a fourth factor that we have to mention. It’s entirely possible that there are minor errors of omission in the data. Some companies may have raised subsequent rounds but those rounds weren’t recorded in the dataset that we pulled from, or it wasn’t labeled correctly. For example, we didn’t take debt financings or crowdfunding into account here. Or a company may have raised, say, a Series E round but that round was labeled “Private Equity” because it came from a later-stage PE fund.
If anything, these omissions may paint a slightly bleaker picture than is actually the case, but the dataset was sufficiently large that such inaccuracies should not have a material effect on the data.
Why Does It matter?
This may seem like a somewhat tedious exercise, but it’s one of dead-serious importance to both entrepreneurs and investors.
Despite some financial uncertainty these days, Seed-stage funding is relatively abundant and has been for about a decade now. A lot of founders who raise Seed rounds with relative ease might be tempted to think that subsequent rounds will be similarly easy to raise, but that’s hardly the case. It could be really helpful to take a step back and evaluate a company’s prospects of raising money long before the need for additional capital becomes pressing.
For many investors, follow-on funding is how they maintain decent positions in their portfolio companies. But how does one budget for that from the start? If your strategy is to invest at Series A with pro-rata follow-on through Series C, it’s really important to know the rough percentage of portfolio companies that will require additional capital commitments from the fund. A few years in, you don’t want to go knocking on LPs’ doors hat-in-hand asking for more money because you underestimated how much support your portfolio companies would need.
Conversely, you don’t want to have overestimated and be left with heaps of capital that could have been invested years ago.
Conclusion
As we’ve shown, the life of an average startup in the investment market is nasty, brutish, and short. But that shouldn’t deter entrepreneurs or investors from starting things or investing in new ventures. It’s very important that we have a realistic view of the market for startup equity across the various stages. This is not meant to dissuade or intimidate, but to challenge everyone in the industry to work hard to earn their place among the companies that make it to the next stage.