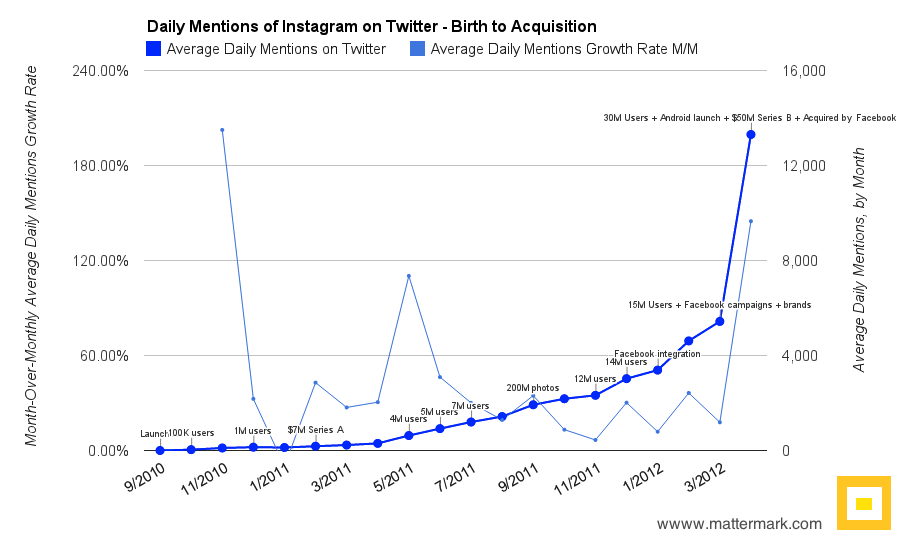
If you were an investor considering Instagram’s Series A, could stats on Twitter mentions have helped you get in on the deal? The company shared on TechCrunch that they had crossed 1 Million users shortly before Christmas 2010, and their funding was announced just 2 months later in early February 2011, so we think it is reasonable to assume they were fundraising during that time.

If you were only looking at daily data, Twitter mentions in the days leading up to the Series A might not be particularly telling. However Instagram was openly publishing about their user growth, going from 130,000 users acquired in the first week (October 2010) to 1 Million just two and a half months later.
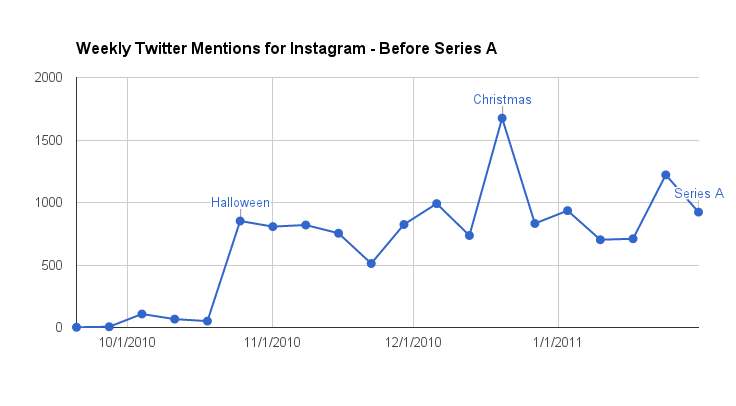
Here are the weekly Twitter mentions of Instagram in the 20 week from launch to Series A, basically a zoomed in view of the earliest and smallest part of our first graph. Interesting to see the spikes around Halloween and Christmas (they hit 1 Million users just a few days before the biggest photo holiday of the year).
Have a burning question you’d like us to address with data? A curiosity? A bet you need to settle?
Email hello@10.147.21.165 and tell us about it, and it might be next Graph of the Week.