All analyses in this report are for U.S. seed investments as reported in Mattermark — The Deal Intelligence Company, and exclude companies in the following categories: biotechnology, pharmaceuticals, cleantech, and energy.
While late stage deals and private equity investment in pre-IPO startups in 2014 lead to the largest amount of capital committed to startups in the past 10 years, overall deal volume in Q4 has dropped to 2011 levels, lead by a plunge in the number of seed rounds:
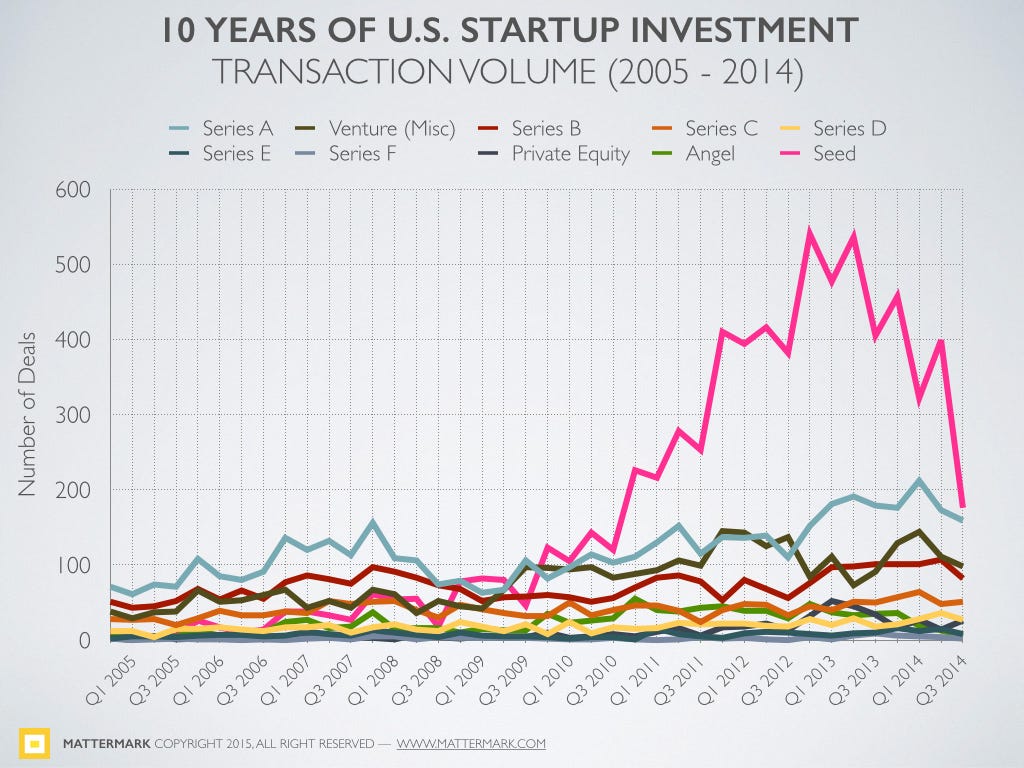
While some investors told me they felt volume and valuations were at an all time high, other highly credible sources confirmed the data echoed a trend they were also seeing with a high volume of seed transactions.
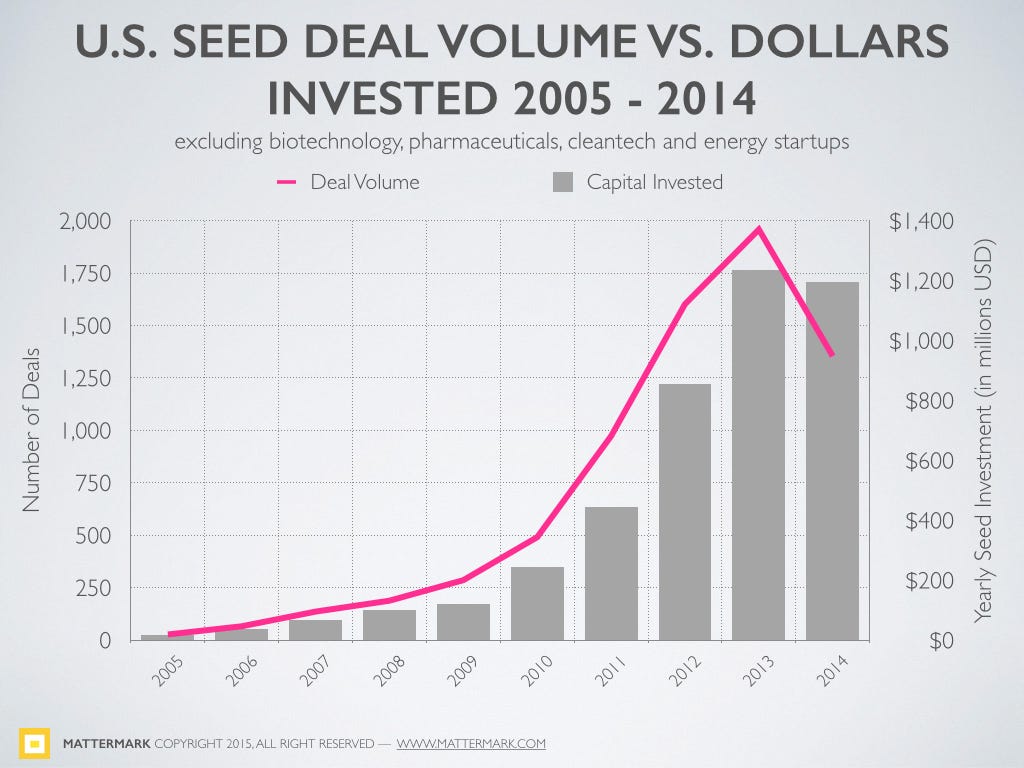
Number of Deals vs. Seed Capital Invested
Without the quarterly breakout it is difficult to discern the downward trend in 2014. On the whole, seed investment dollars in 2014 looked very similar to 2013 but the number of deals dropped 30%.
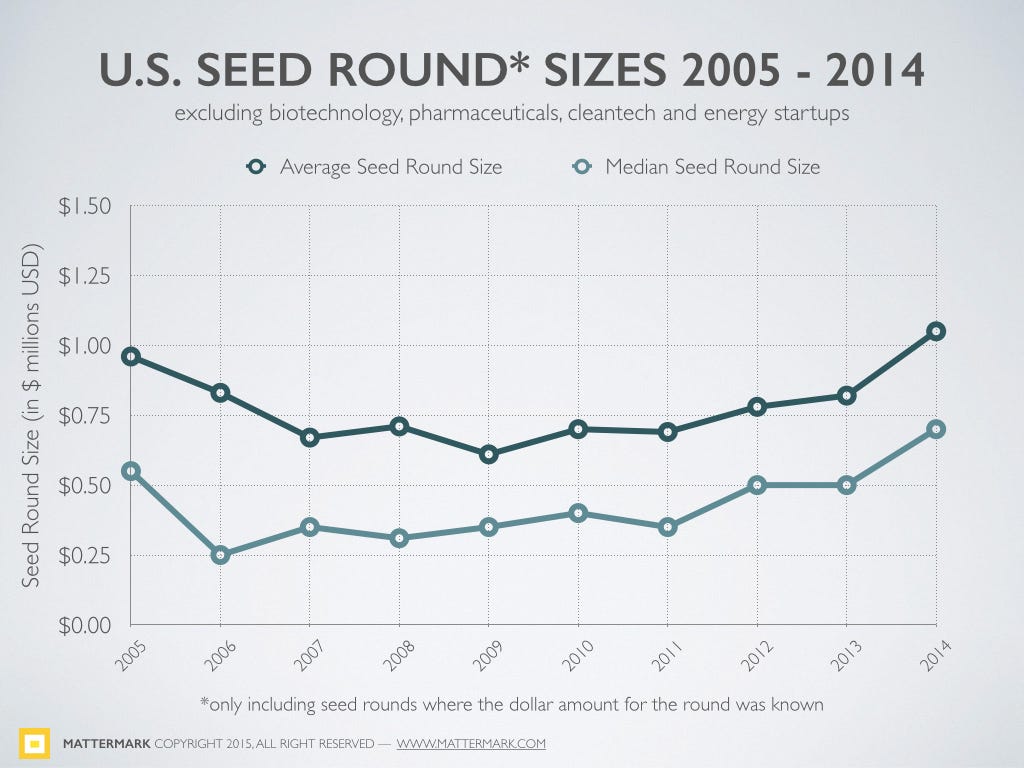
This drop in number of deals, without a similar decline in investment dollars, indicates that the average seed round in 2014 was larger —in turn suggesting the valuation or valuation cap of the average round increased. And indeed, the average seed round rose 28% while the median rose 40%.
Exploring Relationships Between Seed Deal Volume, Capital Deployment & Key Economic Indicators
Startups continue to receive what Fred Wilson called “eye popping EBITDA multiples” in his March 2014 post “The Bubble Question”. Fred goes on to explain the connection between artificially low interest rates resulting from the U.S. central bank’s reaction to the 2008 financial crisis, and the picture he paints is a story of investors’ struggle to find decent returns in a low interest rate environment where money is cheap and undifferentiated.
Since the financial crisis of 2008, policy makers in the developed world have kept interest rates at or near zero. They have flooded the market with cheap money in an attempt to heal the wounds (losses) of the financial crisis and incent business owners to invest and grow their businesses. That has not worked particularly well but it has worked a bit. Though their words have changed in recent years, their actions have not changed very much. We still are in a policy framework where money is cheap and interest rates are near zero.
If you go back and apply the formula [yield = earnings/purchase price] and use zero for yield/interest rate, then one would pay an infinite amount for an earning stream. Of course that doesn’t make sense and it has not happened. But valuations are at extreme levels because you cannot get a decent return on your money doing anything else.
At some point this will change. The yield on the 30 year treasury yield has been sub 5% since the financial crisis. If (when?) it gets back to the 6-8% range where it was for most of the 1990s, we will be in a different place
With this guideline in mind, we can get some understanding of the key drivers for startup investment volume on the whole — which from a dollars perspective is at an all-time high. I’ve focused on the changes in the seed funding landscape because these are things that will impact the ecosystem 2 to 5 years from now as these companies progress into later rounds of funding and exits. This is the pipeline for VC dealflow.
To gain a more firsthand understanding these two factors’ impact on seed funding and the VC pipeline, we’ll take a look at the 30 year treasury yield and a few other economic indicators. We examined association between seed investment activity and a few economic metrics. Our analyses found these indicators to be strongly correlated with seed investment activity:
- The NASDAQ Composite Index
- The 10 Year Treasury Interest Rate
- The 30 Year Treasury Yield
- The U.S. Monetary Base
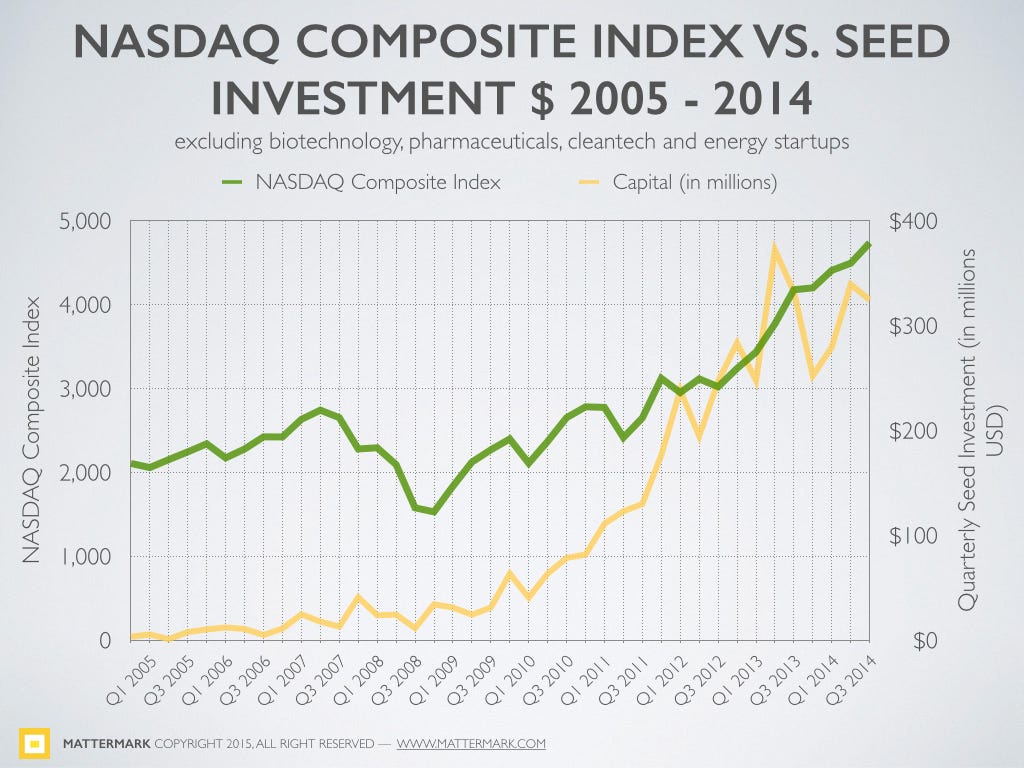
The NASDAQ Composite Index
There is a strong positive correlation between seed investment dollars and the NASDAQ Composite Index (r=0.88, p≤0.001)
10 Year Treasury Rate & 30 Year Treasury Yield
There is a strong negative correlation between the 10 year treasury rate and seed investment dollars (r=-0.67, p=≤0.001), and a strong negative correlation between Treasury Yield 30 Years (^TYX) and seed investment dollars(r=-0.65, p≤0.001)
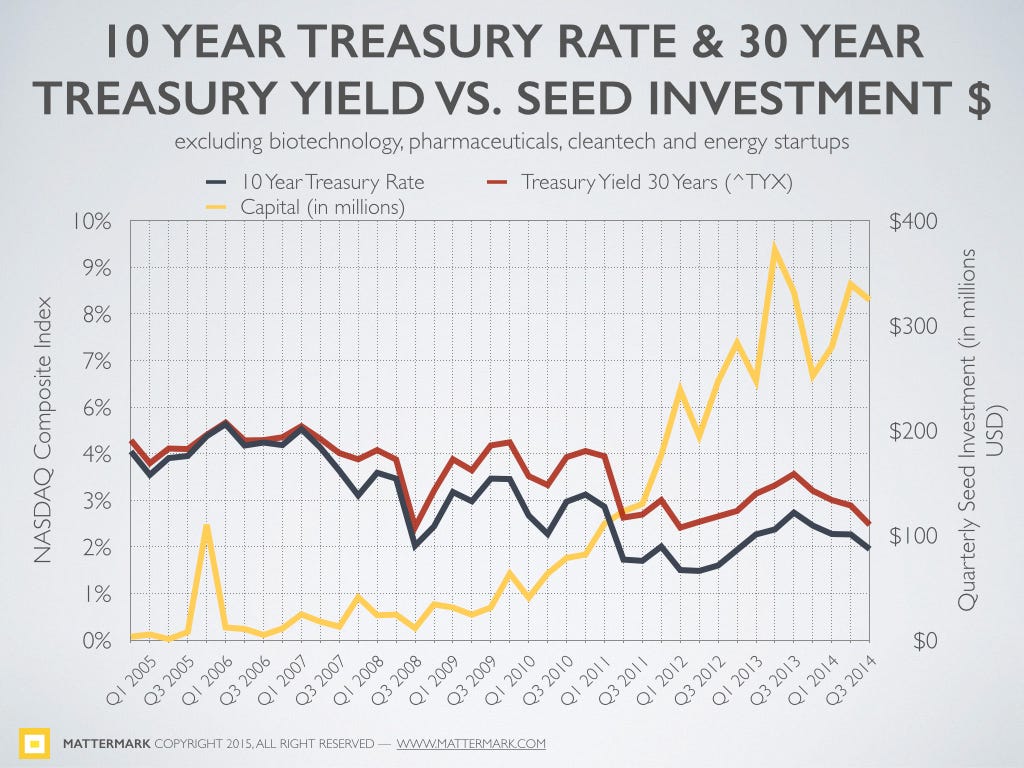
Board of Governors of the Federal Reserve System (US), 10-Year Treasury Constant Maturity Rate [DGS10], retrieved from FRED, Federal Reserve Bank of St. Louis https://research.stlouisfed.org/fred2/series/DGS10/ January 15, 2015.
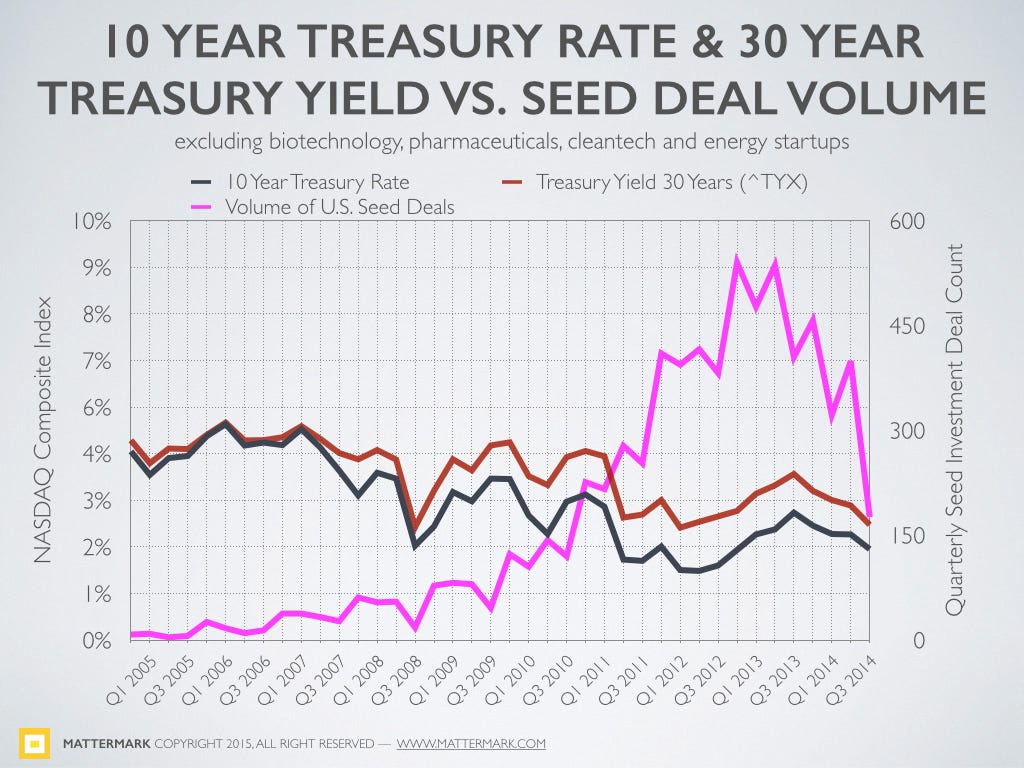
There is an even stronger negative correlation between 10 year treasury rate and the volume of seed rounds (r=-0.75, p≤0.001), as well as a strong negative correlation between treasury yield 30 years (^TYX) and the volume of seed rounds (r=-0.68, p≤0.001)
What Does It Mean?
This is the place where I pause and remind you that correlation, no matter how strong, does not make a case for causation on it’s own. Instead, we use domain knowledge and the opinions of experts like Fred Wilson to explore the causal connection between interest rates and the availability of capital to start new ventures. Predicting the future is not the goal here, it turns out describing and understanding the world as it is, is quite challenging enough.
The large drop in Q4 is interesting for several reasons. First, there is a seasonal effect to startup funding and you can see from the final graph that Q4 tends to see a decline or at least plateau in financings each year. However, the steep decline might also be investors (over?)reacting to mounting concerns about valuations and economic correction related to tapering of central bank activities.
And of course there is another possibly — maybe hundreds of startups collectively decided to stop announcing their funding rounds? If you raised a round in Q4 2014 and would like us to add it to our analysis simply tweet to@Mattermark or email data@10.147.21.165
What To Expect in Q1 2015?
It’s a bit early to tell how this quarter will shape up, but you can count on the team at Mattermark to keep you updated as we continue to track this fascinating relationship between seed funding events and economics indicators. A couple things to think over:
- Are seed financing by high net worth individuals a leading or lagging indicator of the economy’s health on main street?
- Are institutional seed rounds really just a Series A with a different name?
- What does this mean for the volume of venture rounds further down the pipeline, and the dearth of new funds coming on the market?
Acknowledgements & Notes
Thank you to Sarah Catanzaro, Joshua Luxton, and Alex Wilhelm for reviewing drafts and providing feedback on this post.
To pre-order our research report on U.S. startup investment over the past 10 years please visit our website and place your order for Feb. 2, 2015 delivery.
Methodology Note: All analyses in this report are for U.S. seed investments only and excludes companies in the following categories: biotechnology, pharmaceuticals, cleantech, and energy.
Sources: This article was compiled with information collected from Mattermark, AngelList, Crunchbase, FRED — Federal Reserve Bank of St. Louis, and NASDAQ.
To learn more and access the raw data used to generate this post, sign up for your free trial of Mattermark professional today.