tl;dr: Last week, we looked at M&A activity at a global scale. Now we’re focusing on the US.

Mergers and acquisitions are a hot topic.
Getting acquired is the most frequent kind of successful exit for founders and investors. Typically, the news covers acquisitions as one-off events. Looking at the network of companies a corporation acquires (such as this list of acquisitions by Facebook) may provide hints about corporate strategy. But there is another kind of network related to M&A that’s worth looking at.
Last week, we analyzed international M&A deal flow and found the US is at the center of the network. This week, by examining the network of M&A activity within and between major US cities, we can get an idea of how connected a given city’s business community is to the rest of the nation and see how relative power and influence is distributed.
We’re going to analyze data from 1,958 M&A deals struck between US companies from January 1, 2015 to the end of August 2016. This represents roughly two-thirds of the M&A deals struck during this time in the US. (For the record, we left out the other third because the metropolitan region to which either the target or acquiring companies belonged is not recorded in the dataset.)
The majority of the companies that were acquired are earlier-stage, and most have some technical component to their business. Many fit the classic mold of what we’d call “startups” but there are some later-stage companies, as well as some manufacturing, life sciences, and energy companies that were acquired as well. This isn’t to say that Silicon Valley-style tech startups aren’t well represented here – they are – but keep in mind that this dataset represents more kinds of companies than the typical high-growth tech startups we typically cover.
Here are some highlights of what we found:
- The network of intercity M&A deal flow is not as concentrated as you might expect. Although the San Francisco Bay Area and New York City are the two largest in terms of inbound and total M&A activity, they don’t have much more activity than Chicago, Boston, Los Angeles, and Seattle. Unlike differences in startup funding activity, the difference between the largest hub and its slightly smaller peers is a matter of degrees, not an order of magnitude.
- However, much like with startup funding activity, New York City edges out the competition, this time for the #1 spot in aggregate M&A activity.
- As expected, a small handful of cities account for the overwhelming majority of M&A activity, but activity isn’t as concentrated in one metropolitan region.
- Leading regional hubs exchange companies with one another quite freely, whereas companies from smaller cities flow more readily to their leading regional hub. (i.e. west coast startups flow to the Bay Area, and Midwestern startups flow to Chicago.)
Most Deals Come From Outside A Company’s Hometown
Out of the 1,958 total deals we analyzed, 468 were sourced from within the same metropolitan region. (Example: A company based in Chicago acquired another company based in Chicago.)
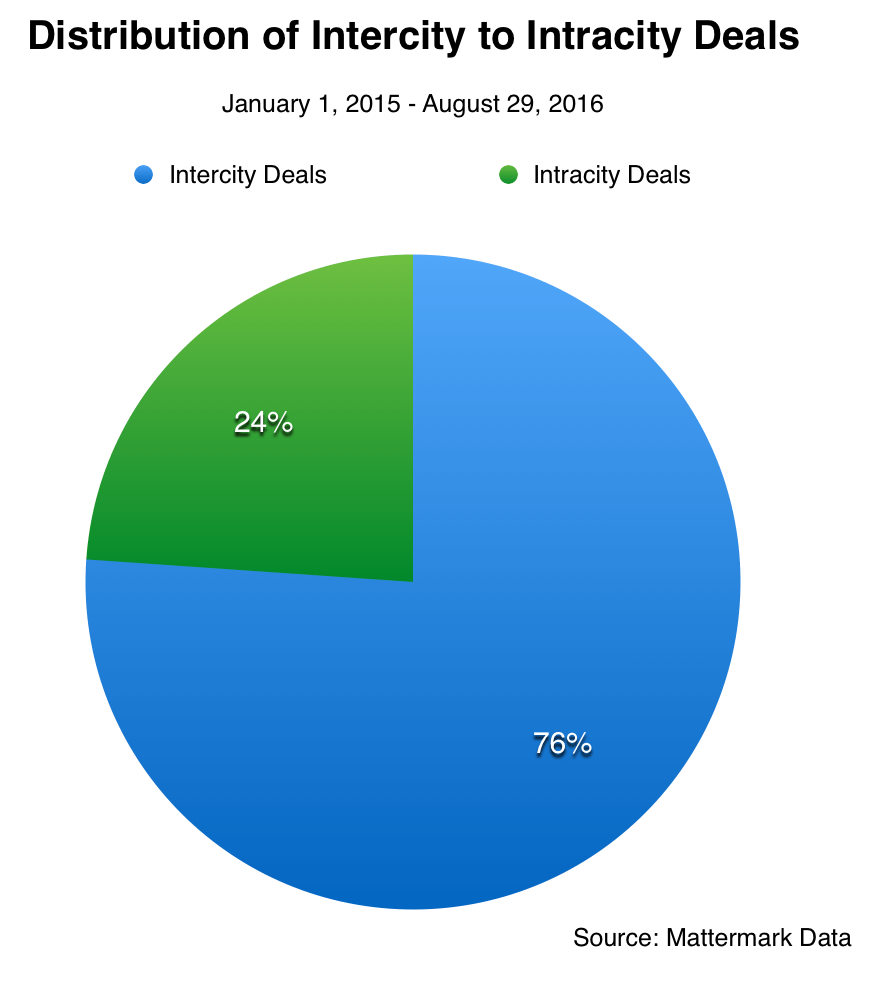
Nationwide, there are approximately three times as many intercity deals compared to intracity deals. This indicates a high level of mobility in the US economy. Now, let’s see how that mobility manifests itself.
One Map, Two Stories of Intercity M&A Deal Flow
In order to visualize the network of M&A deal flow, we fed a set of over forty geotagged nodes representing major US metropolitan regions into Gephi, then we added a list of 565 edges weighted by outbound deal flow and positioned the nodes using the Geo Layout algorithm. The resulting weighted directed graph visualization is fairly easy to read.
There are a few things you’re going to want to pay attention to:
- The Position of Nodes – Nodes are positioned by latitude and longitude, creating a kind of ghostly outline of the USA.
- The Size of Nodes – Nodes are sized by indegree. Bigger nodes have more inbound M&A deal flow than smaller nodes. Nodes are labeled with the name of the corresponding city and nodes’ labels are sized proportional to indegree as well.
- The Color and Thickness of Edges Connecting the Nodes – Like we mentioned above, edges are weighted by the number of outbound M&A deals. In both visualizations, the edges take on the color of their origin node.
In each of the directed graphs below, the colors of nodes and edges differ and we’ll explain those differences in context.
Which cities have the biggest net gains (and losses) when it comes to M&A? This is an important question with a double-edged answer. For investors, government agencies, and entrepreneurial and corporate community leaders, it’s worth knowing if their city is experiencing a “brain drain” relative to other cities in the region. Entrepreneurs in those cities may have a hard time building a long lasting community and unique culture if their ecosystem is constantly losing the best and brightest to major hubs.
In the network visualization below, nodes are colored by their relative share of inbound M&A. “Cooler” colored nodes (the blue and green ones) have the most inbound M&A deal flow, whereas “warmer” colors (yellows, oranges and reds) have the least. The warmer the color, the more likely that city is experiencing a net drain of companies to other cities.
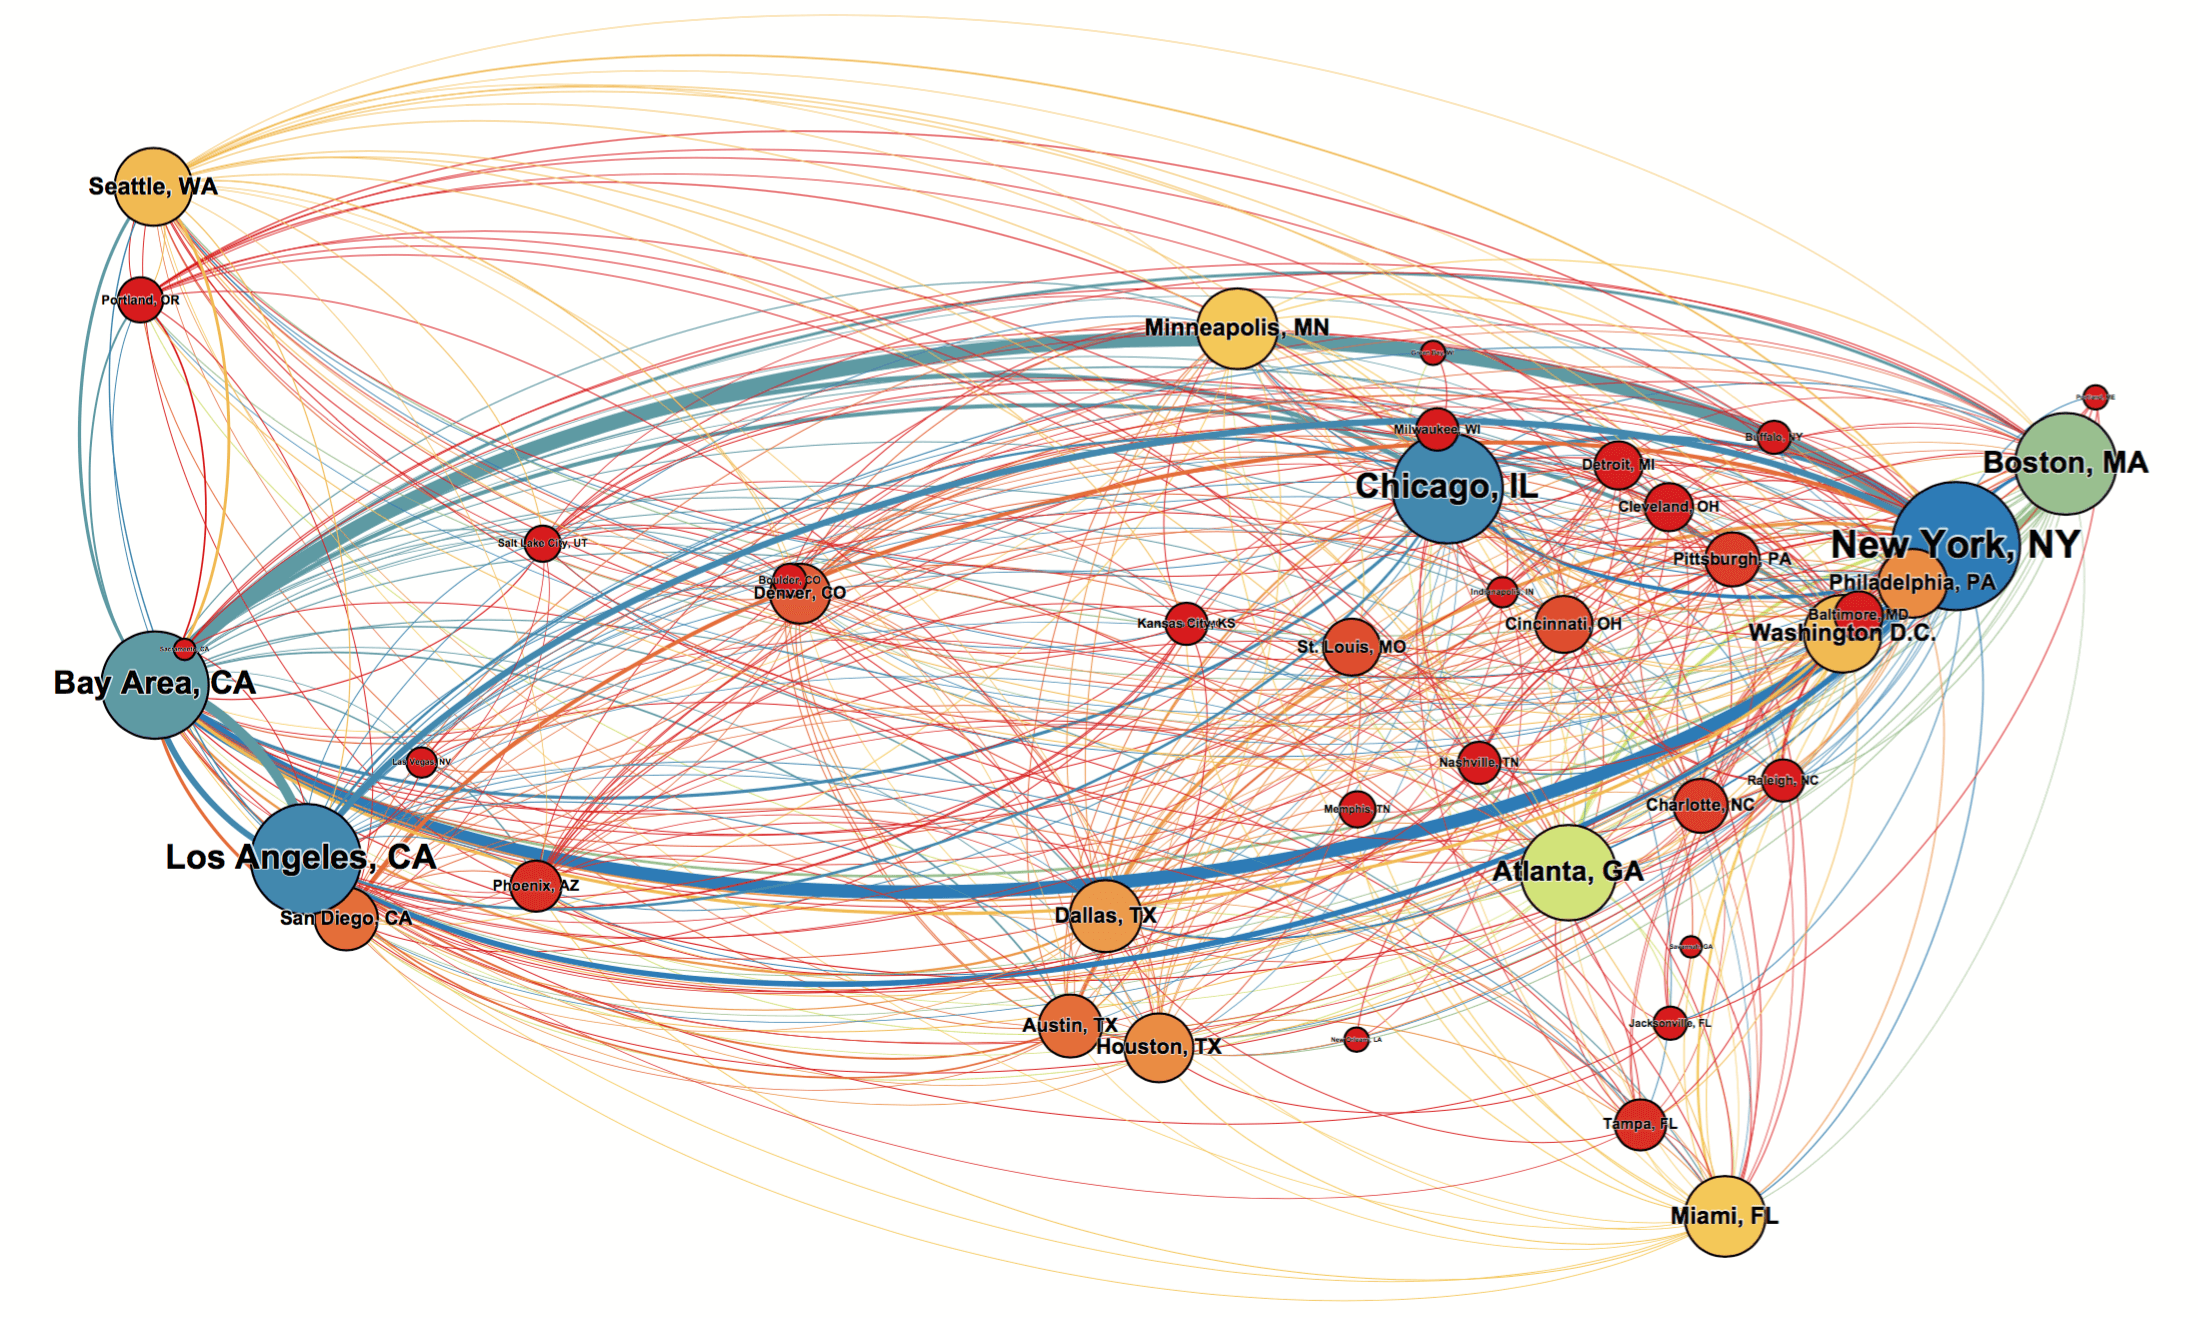
What’s striking here is just how few metropolitan regions experience a net gain. The map is mostly a sea of orange and red dots. In the network of intercity M&A deal flow, just a few cities are acquiring the bulk of the companies. If you’re not in New York, Chicago, Los Angeles, or the Bay Area, companies in your metropolitan area are more likely to be acquired by a company from one of those cities than vice versa.
Regional Affinity
What does the flow of acquisitions look like between regions? Do acquiring companies have an affinity for companies from their own region of the country, or does it not particularly matter where the target company is from?
The network visualization below colors nodes by region.
- New England and the northern east coast are colored green.
- Midwestern cities are colored blue.
- The south is a rich burnt orange.
- Western cities like Denver are dark cyan.
- The west coast is colored dark pink to contrast with the green of the east coast.
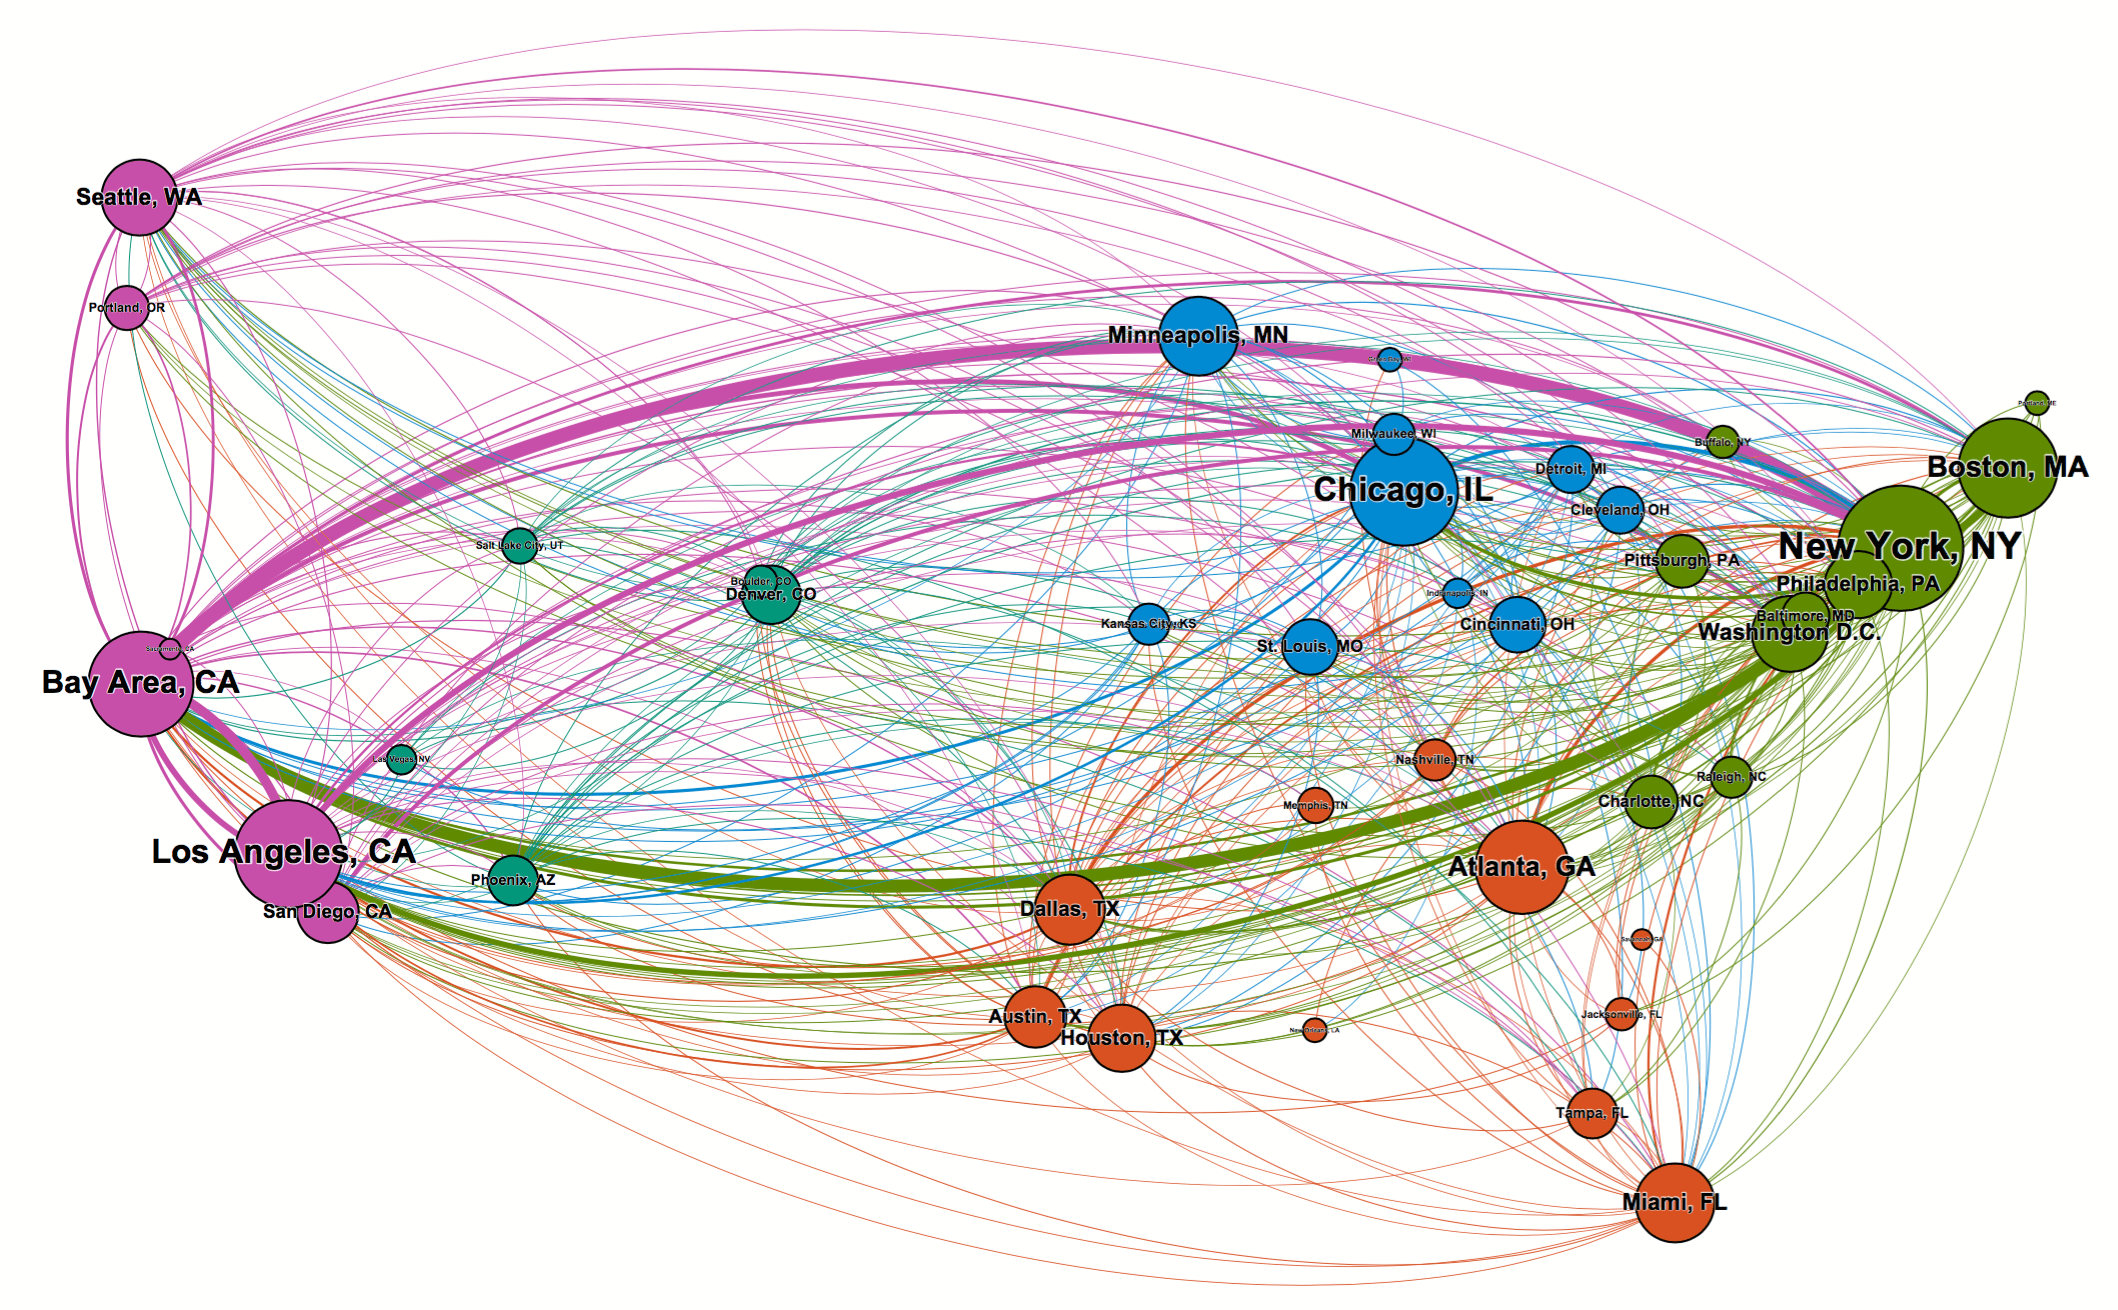
Here we can see that New York and the Bay Area are strongly tied in the intercity M&A deal flow network, accounting for a cumulative 6.5% of all intercity deals made since January 1, 2015 and the end of August 2016.
In terms of finding the leading hubs in each region, there are few surprises. Here are the three takeaways:
- The Bay Area is far and away the leading regional hub in the west coast, and there is a relatively balanced pattern of exchange between the Bay Area and other major business and startup ecosystem like Los Angeles and Seattle.
- On the East Coast, there is a fairly equal balance of exchange between New York and its regional peers like Boston, Philadelphia, and Washington, DC.
- In the Midwest, Chicago is the leading hub and serves as the main destination of much of the outbound M&A deals from other Midwestern cities.
In general, companies from major regional hubs will acquire companies from other regional hubs at a fairly consistent and balanced rate, as we can see in the relationship between New York, the Bay Area, and Chicago. However, in general, within a region, companies are more likely to move from the periphery to their local hub than be acquired by an entity on the other side of the country. This regional cliquishness is particularly present along the coasts; a company from Baltimore is more likely to be acquired by a company in New York or Washington D.C. than Seattle.
Hometown Heroes: Where Is The Highest Ratio of Intracity M&A?
Based on the network visualizations we just discussed, it’s easy to intuit that much of the intercity M&A activity is concentrated in a small handful of cities. But where do these cities rank when accounting for intracity M&A as well?
Let’s take a look at the top 15 cities ranked by the number of all M&A deals struck since January 1, 2015.
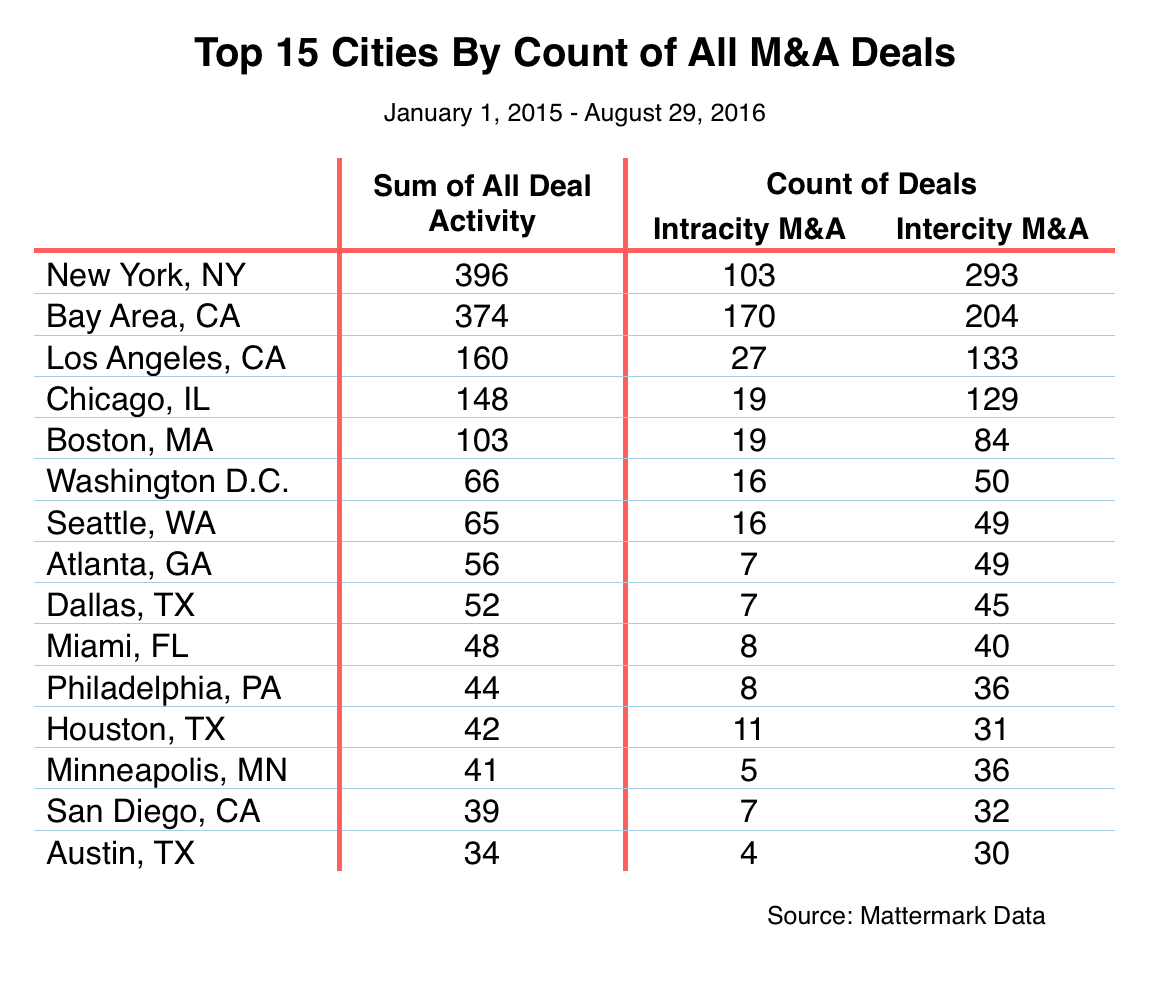
It should come as no surprise that the metropolitan region with the highest GDP in the country (at least as of 2014) has the highest level of aggregate mergers and acquisitions activity as well. The Bay Area ranks highest in terms of the number of companies acquired from outside the region and second overall, which (again) shouldn’t be surprising given the region’s vibrant startup ecosystem and preponderance of large companies that acquire smaller upstarts for fresh talent and interesting intellectual property.
But this doesn’t tell us anything we didn’t already know. Big cities are more likely to spawn more companies for big incumbents based in the same city to scoop up, and they’re more likely to attract companies from smaller cities.
The Domestic M&A Network: What We’ve Learned
Looking at M&A networks gives us some insight into the relative influence of different metropolitan regions in a way that simply looking at startup funding and other metrics can’t. Corporate and entrepreneurial communities that acquire lots of companies, especially those from outside their own metropolitan region, hold more sway than those communities with fewer acquisitions. A company in New York City can acquire another company from hundreds of miles away with greater ease than a company based in, say, Salt Lake City.
Network analysts know that research findings depend on the level at which you analyze the networks in question. For example, at the international level, the US dominates in terms of level of connectedness and ability to attract companies from around the world. But looking at the US alone, focusing on metropolitan regions as the primary unit of analysis, we find a much denser, more distributed network.
Although this analysis paints a more nuanced picture of relative influence and economic power in the US, one thing remains constant: M&A activity tends to flow from small ecosystems to big ones.