
Marketplaces are incredibly powerful. They are taking every aspect of our economy by storm and changing how goods and services are discovered, priced and delivered. They work for everything from digital goods to food and lodging to getting a great massage at home! And once they have achieved liquidity, their strong network effects make them hard to displace and hyper-scalable.
Yet achieving liquidity and crossing transactions is really hard. We at Accel love marketplaces but we also realize how difficult they are to build. From our years of investing in many types of two-sided marketplaces, we have acquired a deep respect for the entrepreneurs who manage to pull it off. So we wanted to share some of the insights that we have learned over the years to help entrepreneurs think about success in the right way from day one.
No two marketplaces are created equal. Some, like Deliveroo, enjoy high repeat rates while others benefit from high AOVs but suffer from low frequency. Some invent entirely new markets like AirBnB while others connect the offline world, like Farfetch. But they all share some common characteristics that we will now delve into, and highlight some of the KPIs that every entrepreneur intent on building a world-class marketplace should be able to rattle off the top of their head!
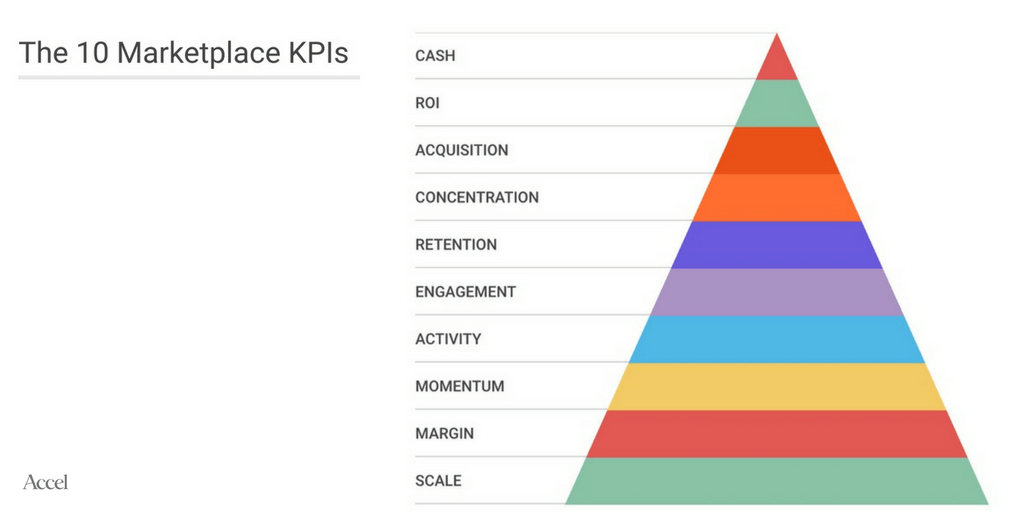
(1) SCALE
Gross Merchandise Value (GMV) stands for the total value of goods or services transacted on the platform. This is how you should measure the total scale of the business and it is equivalent to Gross Revenue figures in e-commerce businesses. For services marketplaces it is best practice to differentiate between “contracted” and “delivered” GMV figures — sometimes there can be a significant delay between the two, leading to an overstated GMV when computed solely on a contracted basis; don’t forget to calculate GMV post-cancelations & returns, to give an accurate view of performed transactions.
Net Revenue represents the actual revenue that accrues to the marketplace, driven by the “take rate”. This is the commission taken for each transaction, typically in a range of 10-30%. Different marketplaces command different take rates, usually based on how much value they add to the sellers — if your marketplace is a key distribution channel, you will be able to charge as much as 25-30%. However, always make sure that your sellers are economically well off — if they are happy, you are happy.
(2) MARGIN
We look at Gross Margin by subtracting the cost of the products sold or services rendered (i.e. COGS) from net revenues. A more revealing measurement of the “true” take rate of the business is Contribution Margin 1, which is further derived by subtracting any other variable costs from GM, such as payment costs, customer service, onboarding, data etc. Next, you should also subtract any type of sales & marketing costs (performance advertising, TV/radio/mail, PR campaigns, field/telesales) from this metric to get to what we call Contribution Margin 2, or how much money you actually make after variable and acquisition costs.
It’s not uncommon to see marketplaces with attractive gross margins but unattractive (and even negative) contribution margins, pointing to expensive customer acquisition, inefficient or manual processes, or a lack of operational leverage. Don’t forget to include seller acquisition costs in your contribution margin! You need both sides of the marketplace to scale.
(3) MOMENTUM
Growth. All else equal, more growth is always better, but with certain considerations:
- Growth should be accompanied by attractive contribution margins and unit economics in order to be economically sustainable in the long run; we don’t like “growth at all costs”!
- Set in place operational processes to allow for the current pace of growth to continue smoothly in the future. E.g. sometimes early-stage startups handle transactions in ways which are not fully automated, in order to fail & learn fast. While this is encouraged and justifiable in the short-run, in the long-run it can be unforgiving, and you should be mindful towards not accumulating undue amounts of “operational debt”
- Seasonality — certain verticals (e.g. real estate, travel, recruiting) experience strong variation in business throughout the year. In these cases, YoY figures would be more accurate than MoM figures to gauge actual growth
Market Share. As you gain dominance, it’s critical to monitor your relative position in the market. You should calculate market share by looking at both traditional incumbents, as well as newcomer marketplaces. Moreover, it’s important to identify cases of market expansion (e.g. Deliveroo) or new market creation (e.g. BlaBlaCar). For an accurate view, look at market share by geo / vertical / product, to see precisely in which segments you hold market leadership. You can achieve this via a combination of traffic monitoring tools like SimilarWeb, download monitoring tools like AppAnnie, parsing of job boards (to gauge the speed of growth), all-in-one platforms like Mattermark, or web scraping of individual listings or services.
(4) ACTIVITY
Liquidity is the lifeblood of the marketplace. You acquired the sellers, you acquired the buyers, now what? It’s paramount that buyers and sellers transact with each other, and ideally a lot. The best way to measure liquidity in the marketplace is to track the % of items or services that get sold/booked, and within what period of time. The higher the % and shorter period of time, the more sellers are making money and buyers are becoming loyal customers.
Average Order Value (AOV) is an especially useful metric to back up the bottoms-up addressable market for your platform, by understanding who your customer demographic is and how much and how frequently they’re willing to spend. More importantly, it’s a key indicator of how much the marketplace makes from its customers with each order. On the acquisition front, channel mix will vary greatly based on AOV (e.g. you can afford to call SMEs outbound to sign them up for a lending marketplace a la Funding Circle, but you can’t do the same for customers of a cleaning service).
A driver of AOV is the # of Items per Basket which showcases the platform’s ability to induce cross-selling. Product recommendation tools for platforms with many SKUs (e.g. Amazon) are handy, while adjacent services in dominant-SKU businesses are helpful (e.g. sell renters’ insurance alongside the booking in a rental marketplace).
(5) ENGAGEMENT
Messages — in certain high-AOV or freemium marketplaces, transactions may not occur right away, and messages (between suppliers and buyers) can drive engagement on the platform as a precursor to purchases. Frequent communication also creates a platform lock-in for both sides of the marketplace (e.g. if the platform becomes a user’s central hub to manage communication with potential suppliers, it has a higher chance of retaining and monetizing that user later on).
Net Promoter Score & User Reviews are critical in determining whether customers a) are delighted by the experience and intend to generate repeat orders and b) will act as advocates for your platform and recommend you to future customers, generating a virtuous viral loop in the process. Also important are reviews from suppliers, which are often not readily available, and which you should go to great lengths to gather. If suppliers are not getting enough quality business, they’ll likely leverage other platforms in the future.
(6) RETENTION
Cohorts showcase the continued activity of a set of customers acquired in a specific period of time. Monthly cohorts typically strike the balance between information/noise ratio and ease of generation. The typical metrics to run cohorts on are revenues, gross/contribution margin, or number of orders. A useful way to portray them is on a %-basis, to remove the effects of (usually) larger recent cohorts, and to easily visualize the long-term stabilization pattern. We advise you to run cohorts across both buyers and suppliers — a leaky bucket in either can lead to a bottleneck in growth! We love marketplaces with strong retention rates, where customers are delighted, come back over and over again, and just can’t get enough of the product or service the marketplace sells them.
Note that Repeat Orders are computed most accurately by running weighted averages on historical cohorts rather than via simple averages (e.g. “30% of our orders are repeats”), which hide true repeat patterns.
Cohort Consistency helps you understand your buyers and sellers even better — are your repeat orders always generated by the same power buyers/sellers, or do you generate activity for your buyers and sellers across the board?
Also, you ideally want recent cohorts to be as strong as early ones, or even stronger as the product improves; this indicates that the business does not only address a small number of early adopters.
(7) CONCENTRATION
Whale curves highlight the concentration of users, either on the demand or supply side. They represent plots of the number of customers vs the % of business these generate over a period of time. For example, you could learn that your top 5 suppliers drove 90% of sales last year and take steps towards diversifying the supplier base in the future. In many marketplaces the 80/20 rule holds — i.e. 80% of the activity is generated by 20% of the buyers or sellers.
Concentration analysis is important, particularly as whales can carry significant buyer / supplier power and can exert a downward pressure on take rates (as suppliers) or burden the CS team (as buyers). In extreme cases, whale suppliers can cap the outcome of your business, by deterring competing suppliers to join the platform. If the whale supplier is a large incumbent, they can even limit the universe of potential acquirers of your company down the road.
Sector / Geo / Product Concentration highlights the underlying exposure of the business to several major segments. Concentration may be a positive thing, as focus is needed in order to serve a delightful customer experience. Concentration could turn bad when the areas generating the bulk of the business have limited upside, and your company is not able to diversify towards higher growth segments or product offerings.
Fragmentation adds a 2nd-order look into the distribution of activity in a marketplace. Is your marketplace a few-to-many or a many-to-many platform? If it’s few-to-few you may not have a business as the need for a middleman is reduced. Many-to-many marketplaces like Etsy bring the most value to a market and are best positioned to defend themselves against disintermediation.
(8) ACQUISITION
Cost Per Acquisition (CPA) or Customer Acquisition Cost (CAC) is a number you should know on the top of your head. Your marketplace economics depend on it! Much has been written about funnel (e.g. AARRR), so we’ll only add that it’s helpful to understand all funnel conversion stages from lead to visit to sign-up to purchase. Ideally, a “user” should refer to an active user as far into the conversion funnel as possible — ultimately you only care about the users who transact. CPAs should be computed for both the supply and demand side, and include all S&M expenses and staff, as well as any above-the-line (TV, radio etc) media.
Channel Scalability — the way to think about this is: if you raised capital tomorrow, which channels would you invest this money in while maintaining a) CPAs and b) the quality of acquired customers? The first can be monitored by plotting the evolution of CPAs by channel by month. The latter is trickier to measure, as sometimes when companies scale dramatically they start bringing in lower-quality users. Not all cohorts are created equally, so monitor this carefully!
Channel Mix is an important aspect of acquisition which shows the ability of marketers to gain leads across a variety of channels. Key lessons:
- Avoid an overwhelming dependency on a single channel. That can easily turn against you (SEO is a classic example, as Google can change their page ranking algorithm overnight), or the channel you rely on may not scale (the partners selling you leads may tap out eventually)
- Relate channel breakdown with CPAs and retention, to understand if different channels generate new users at a similar cost and with a similar ROI
- The more word of mouth and organic traffic, the better
Our advice is to think outside the box as much as possible — although traditional channels like SEM and FB will always be important, they will likely also be expensive; e.g. Deliveroo scaled for a long time with low-cost offline flyers through snail mail. Whenever possible, get your suppliers to do marketing for you; for example, if Farfetch boutiques direct their customers to your platform for online shopping, these are free buyers the platform may otherwise not reach.
(9) ROI
Lifetime Value (LTV) points to the expected economic value a buyer or supplier can generate on the platform over their lifetime. You’d generally compute LTV on a 1-to-3 year timeframe (or even longer for consumer finance products with high stickiness), on a contribution margin basis (but before acquisition cost). You can generate an LTV curve by performing a weighted average of monthly customer cohorts (weighted by their size), and by plotting its cumulative sum.
LTV/CAC is essentially the ROI generated by acquiring an incremental user. While benchmarks for various verticals exist, you should typically desire a >1-1.5X 1-year LTV/CAC and a >3X 3-year LTV/CAC on a contribution margin basis (again, exceptions exist e.g. in consumer finance). Note that this metric is inversely correlated to the payback time (in months) needed to win back your CPA.
Unit Economics give you an accurate view of whether an average transaction on the marketplace is bringing an economic benefit to the company. You start with AOV, and then subtract the cost per transaction associated with that order (inferred from demand- and supply-side CPAs) as well as any associated variable costs, such as customer service. Needless to say, you need positive unit economics to have a long-term viable business.
(10) CASH
Burn Rate. This may sound obvious, but your marketplace business will only win an industry if you are also building a going concern (i.e. a long-term sustainable business). Diligently monitoring burn rate & fundraising needs is crucial, particularly as “spending to gain market share” has become a popular arms-race in certain verticals. A minimum of 6-12 months of runway and positive contribution margins for early-stage businesses are important, while a path to profitability is key for later-stage ones.
All commerce companies live and die by their numbers. Details, details, details! Marketplace founders should be tracking these KPIs and build the infrastructure to generate them automatically and on-the-fly. Your focus as an entrepreneur will of course shift to a different subset of these KPIs as your marketplace grows.
One of the key reasons for failure in marketplaces is that either supply or demand gets “burned” as the business becomes either demand-constrained or supply-constrained. In their quest for growth, entrepreneurs will often be tempted to drive one side of the marketplace hard and not pay enough attention to the actual liquidity they are building. A numbers-driven founding team, a strong BI backbone, and an experienced board will help startups successfully manage these challenges and become the next AirBnB, Farfetch or Deliveroo!
Join thousands of business professionals reading the Mattermark Daily newsletter. A daily digest of timely, must-read posts by investors and operators.
Special thanks go to Luciana, Fred, Sonali and the rest of the Accel team for their valuable feedback and help in editing this piece. This was originally published on LinkedIn Andrei Brasoveanu on the Venture Team at Accel.