Editor’s Morning Note: It’s still a damn fine time to raise money.

From a long bull market to a period of temporary fear earlier this year, it’s been fun to track the venture capital market.
The market has cooled, but not to the extent that some expected when slumping markets caused bells to sound. In fact, it seems that negative public sentiment skipped slightly ahead of market fundamentals, a 180 degree turn from the more heady days of the recent past.
To help us understand where we stand now, the fine humans from Fenwick & West recently released a report concerning the second quarter’s fundraising climate that will help. Why further examine the second quarter? If you drive blind, you can’t go very far1.
Skating Above Normal
It’s clear that the venture capital market in the United States has deflated some from its cycle-highs. What’s less apparent is is how far from the baseline it currently rests, and if the delta from today to historical norms is positive or negative.
Fenwick has three key paragraphs. The first deals with up rounds: “Up rounds exceeded down rounds 74% to 13%, with 13% flat, in 2Q16. […] The 12 year average of up rounds is 66%.” So rising valuations are above longer averages.
Following, average and median prices changes:
“The average price increase of financings in 2Q16 compared to the company’s prior financing (the “Barometer”) was 40%. […] The 12 year average for the Barometer is 56%. The median price increase of financings in 2Q16 compared to the company’s prior financing was 31%. […] The 12 year average median increase is 28%.”
That sums to two positive data points out of three. If you wish to score the median as more important than the average, it’s up to you. What matters is that there were more up rounds in the second quarter than there would be according to historical averages. More than half of those rounds saw price increases above what we might have expected.
The trend is negative. Last quarter’s up round percentage was the lowest since at least the third quarter of 2014. That means that the people predicting doom were doing so when market were deteriorating. The no-fun kids2 were at least directionally correct.
Take us home, Fenwick:
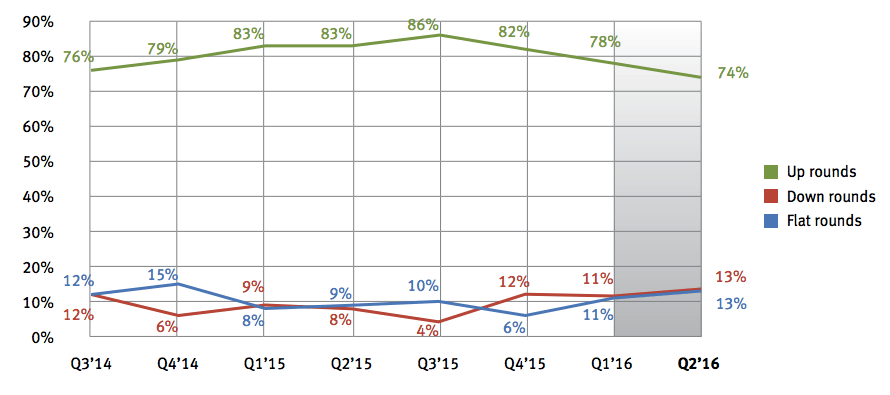
The last-quarter down round percentage is the highest in the displayed range. That’s not good. The second quarter saw the second-highest percentage of flat rounds. That’s also not good.
The Late-Stage Quandary
If aggregate venture capital performance is strong but weakening, we’ll need to know a bit more about where things are slipping the most. After all, what’s a race without a loser? The Olympics certainly wouldn’t be much fun3.
There are two charts that detail which venture series is taking the most damage. It’s not Series B, which would have been my first guess, but instead what we can call Series E+, or Series E rounds and later.
Our first chart shows the percentage of down rounds by series, over time. Check the red line:
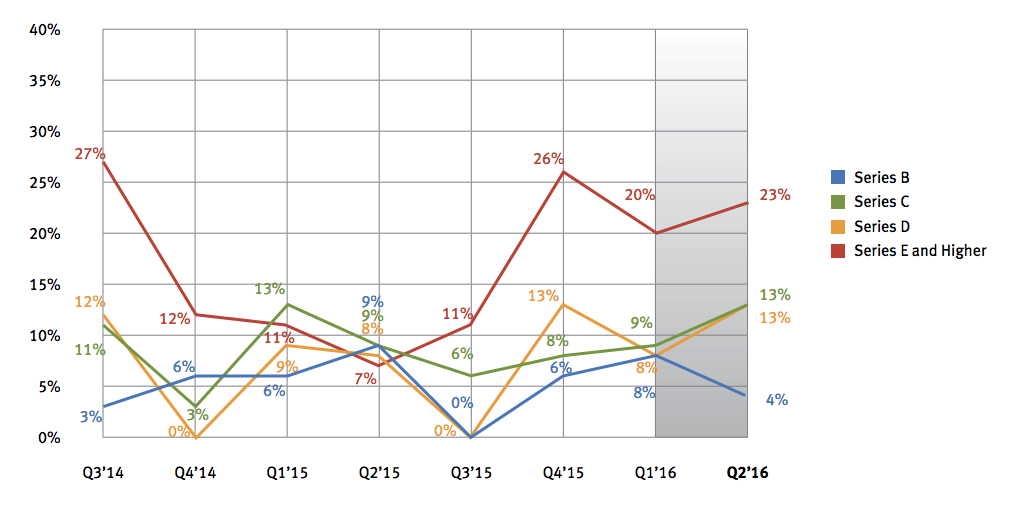
The ratio of down rounds to up rounds among very late-stage capital fell during the best recent startup years—the unicorn period, really—and rose as global conditions fell apart and local economic woes increased.
And finally, the following chart shows “the average percentage change between the price per share at which companies raised funds in a quarter, compared to the price per share at which such companies raised funds in their prior round of financing:”
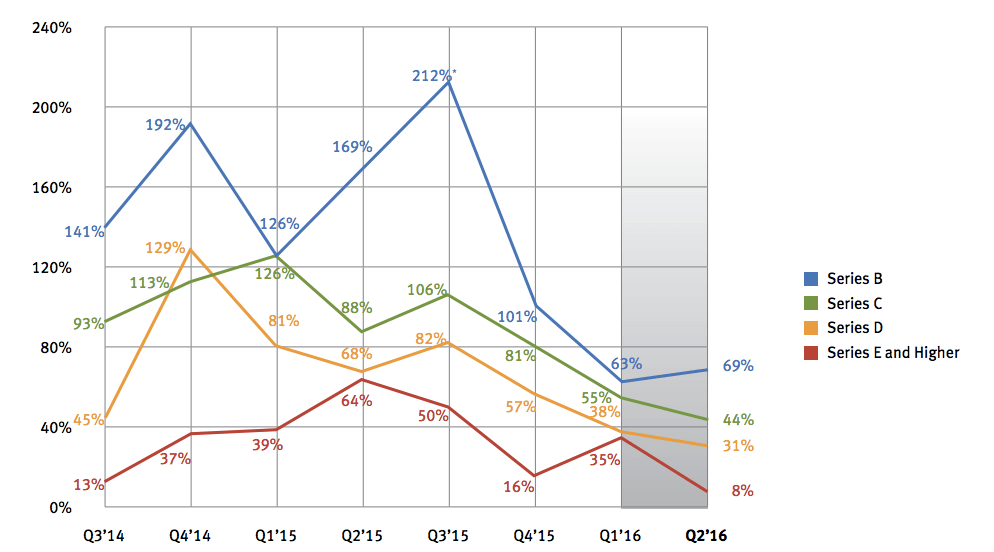
In the first chart of this section, having your line on top was bad. In the second, it’s bad to be on bottom.
The correlation isn’t surprising; however, you would expect the Series with the highest percentage of down rounds to be the Series with the lowest average price increase, keeping in place our prior knowledge that up rounds as a percentage of rounds remains above historical averages.
If you observe both charts at once, you’ll notice that Series B, C, and D rounds are seeing average-ish down round percentages, but flagging valuation growth. If you wanted to encapsulate Summer ’16 and avoid Drake, that’s not a bad conclusion.
—
All of this is to depress talk that things are horrible, terrible, or downright soggy. Your company might be those things, to be fair, but the market is merely less frothy than it was before. In business, you can’t even hope for that much.
- This paragraph must count as a mixed metaphor, even if it took us several sentences.
- Free ska band name, if you want it.
- What is the Clinkle of the Olympics?