tl;dr: VC investment into US companies slowed in Q2, but the first half of the year posted some positive indicators.
Instead of burying you under a pile of numbers this quarter, Mattermark has condensed our second quarter venture capital analysis into a consumable size.
To that end, what follows is a quick, but sufficiently deep look at the world of US venture capital in the second quarter and first half of this year.
Keep in mind we’re observing data based on when rounds were announced. There is always lag between when a round is closed, money is wired, and the news is announced or broken. Different sources have their own methods. Also, what counts inside of venture tallies can differ, based on source preference. So every dataset that reports on venture will have its own inherent biases. Our data today, for example, discounts private equity investments to constrict the data set to a more purely venture capital set of metrics.
Let’s have some fun.
The Second Quarter
Mattermark’s last look a the second quarter of venture capital in the United States noted slipping round volume and dollars invested. Today, we’ll compare aggregate second quarter tallies to the sequentially preceding quarter (the first quarter of 2016) and the year-ago quarter (the second of 2015).
Here’s where things wound up:
The Core Data
Number of Q2 2016 US VC rounds1: 665
Percentage basis:
- Change from Q1 2016 VC: -33.9 percent
- Change from Q2 2015 VC: -22.1 percent
Number basis:
- Change from Q1 2016 VC: -342 rounds
- Change from Q2 2015 VC: -189 rounds
VC dollars invested in US companies Q2 2016: $12.5 billion
Percentage basis:
- Change from Q1 2016 VC: -16.9 percent
- Change from Q2 2015 VC: -23.6 percent
Number basis:
- Change from Q1 2016 VC: -$2.5 billion
- Change from Q2 2015 VC: -$3.8 billion
Summing up: Venture capital activity fell in the second quarter compared to the sequentially preceding quarter and the year-ago quarter. Deals fell more sharply on a sequential basis, while dollars invested fell more steeply on a year-over-year basis.
The Key Chart
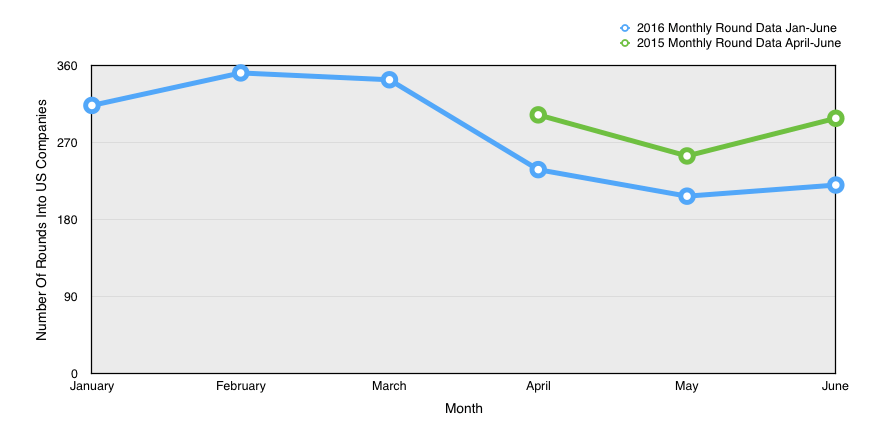
This is the visual reflection of the second quarter of this year, last year, and the first quarter of this year.
Mattermark’s Take
With more than $12 billion disbursed in the quarter, it’s hard to be too negative, even if the three-month period failed to live up to its sequential and year-ago comparisons.
Recent data from the NVCA and Thomson Reuters indicates that US-based venture capitalists raised around $8.8 billion in the second quarter, a figure down dramatically from the preceding quarter’s more than $14 billion tally. The first quarter was generally considered to be local maximum, in terms of dollars raised by venture firms, making the direct comparison slightly unfair.
However, when you compare venture intake and compare it to investment, it’s clear that things are still heated; venture capitalists are still spending more than they are taking in by a decent percent.
What’s ahead? We have some early anecdata for you: Popular venture capitalists Jason Lemkin hinted at the start of the quarter that things might have become a bit warmer by the end of the quarter than the data shows. We’ll see what the July data looks like when the month closes.
For now, rounds rebounded in June on a sequential basis, while dollars invested fell on a sequential basis. It’s up to you to try and pull a trend from that particular hat.
The First Half
A single quarter is but a short glimpse into the moving average of a long cycle. So let’s double the time for twice the fun and compare the first half of 2016 to the first half of 2015.
The Core Data
Number of H1 2016 US VC Rounds: 1672
- Change from H1 2015 +4.7 percent
- Change from H1 2015: +76 rounds
VC dollars invested in US companies H1 2016: $12.5 billion
- Change from H1 2015: -13.9 percent
- Change from H1 2015: -$4.2 billion
The Key Chart
Extending our prior chart to include full-half 2015 data, we can compare the six month periods in a fun way. You can eyeball the positive round result for the first half of 2016 by eyeballing the comparison gap between the first quarter of each year, and the second, summing your own estimates. It should gut check out if you are reading the graph properly.
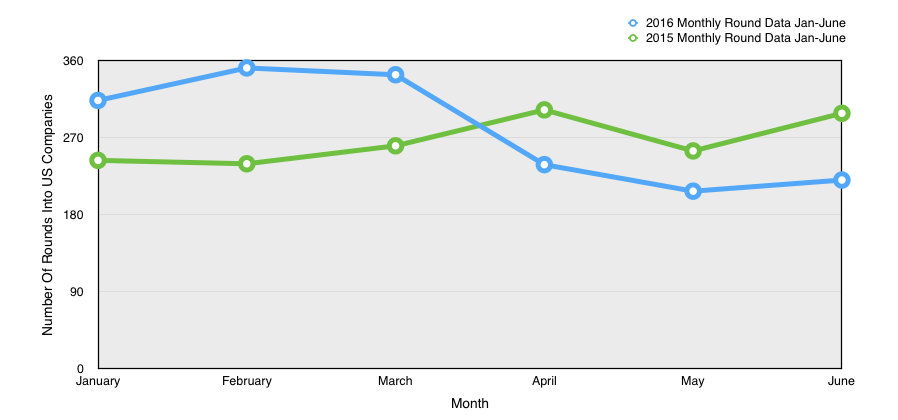
Notable in the above: The choppiness of 2016 in terms of per-quarter changes, compared to the relatively steady first half of 2015. The trend in 2015 was also positive, something that cannot be said about the same period this year.
Mattermark’s Take
Rounds rose, but dollars invested fell. It’s not exactly a wash, as dollars invested fell more steeply than rounds rose, but there is some good news to hang onto. However, at the end of the first quarter, round volume was up more, and dollars invested were down less. That means that the second quarter brought a decline in both metrics.
Our second quarter data noted in the first section, of course, underscores the conclusion. Therefore, the first half of this year looks a bit rosier than on average than the final months of the second quarter might otherwise indicate. Finally, the last month of the second quarter was the lowest in the half in terms of rounds, and third lowest for dollars invested. Sixth and fourth place aren’t great ways to close out a half.
The Second Quarter In Context
To wrap up our quarterly analysis in the aggregate, here’s the last six quarters:
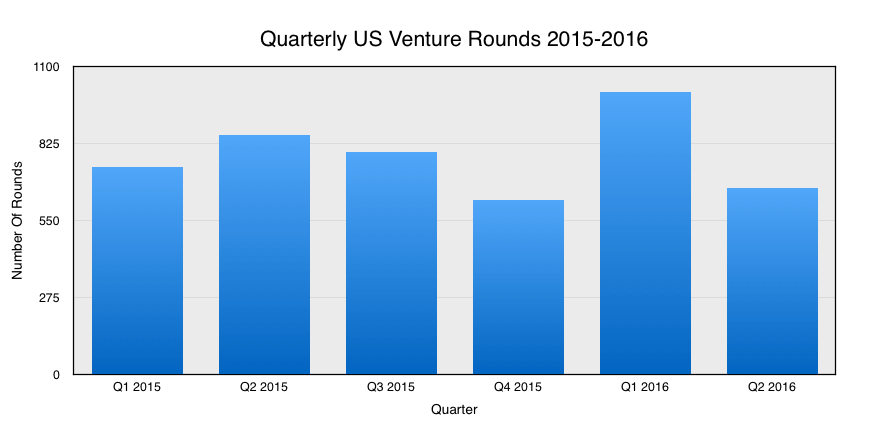
How does the chant go? Q2! We’re not Q4! Rah rah! Something like that.
Quickly, Let’s take a look at some per-Series information to update our prior coverage. Quickly:
Q2 Seed rounds:
- Percent change from Q1 2016: -61.4 percent
- Percent change from Q2 2015: -42.4 percent
Q2 Series A rounds:
- Percent change from Q1 2016: -16.8 percent
- Percent change from Q2 2015: -8.4 percent
Q2 Series B rounds:
- Percent change from Q1 2016: -1.4 percent
- Percent change from Q2 2015: -12.4 percent
Q2 Series C rounds:
- Percent change from Q1 2016: -20.9 percent
- Percent change from Q2 2015: -15 percent
Q2 Series D rounds:
- Percent change from Q1 2016: -10 percent
- Percent change from Q2 2015: -10 percent
Q2 Late Stage rounds:
- Percent change from Q1 2016: -13.6 percent
- Percent change from Q2 2015: -44 percent
That is a lot of red ink, mirroring both our prior notes on aggregate quarter performance, and our mid-quarter notes about what things were shaping up to look like. Keep in mind that the steeper the decline from the first to the second quarter of this year, the more it shows the strength of the first—skewing our first half results towards the start of the year.
Where To Next?
We’ll follow up on our own data with an analysis of all second quarter venture data when all normal sources report an averaged figure, as before.
For now, here’s a final thought: What if analysts had to predict future venture capital activity, akin to how economists predict job or GDP growth? Would the exercise be useful? I’m torn. It wouldn’t be hard to use a moving average, current economic realities, public market changes, and some insider yakking to get a decent guess in mind. Email in if you think that an anonymized estimate list would be useful. A good question would be who might use or benefit from its existence.
So that’s the second quarter. Onto the third.
- As noted, VC data presented discounts private equity.