tl;dr: Unless something crazy happens with funding announcements in December, U.S. venture capital activity is on pace to end the year down from 2015 highs.

As the year comes to the close, we begin preparations for our annual venture capital industry report. After writing these for the past 3 years, I’ve noticed by the end of November, the trend for the year is usually set. While some more data will roll in and more deals will be announced in December, we should not expect the existing trend to shift dramatically.
2016 Venture Capital Round Sizes Are Down 20% YoY
There has been broad discussion of down and flat rounds, especially for unicorn companies. Data across all deals in 2016 shows the average change across all stages is 20% down in round size. Assuming investors are generally taking the same ownership percentages as before, this gives us a general sense of how much valuations have compressed year-over-year.
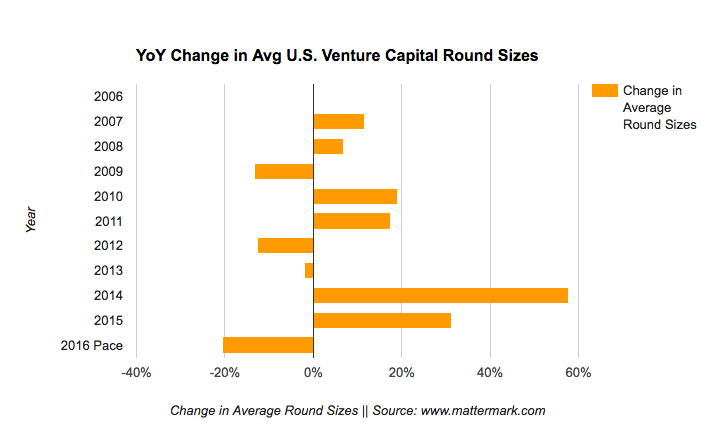
While 20% is the blended number across all rounds, the trend was felt most strongly for Series D stage deals, which saw a deal size change of -33%. Deal sizes were down for all stages except Series C, which saw a 5% increase in average deal size, from $33.6 million to $35.4 million over the past 11 months.
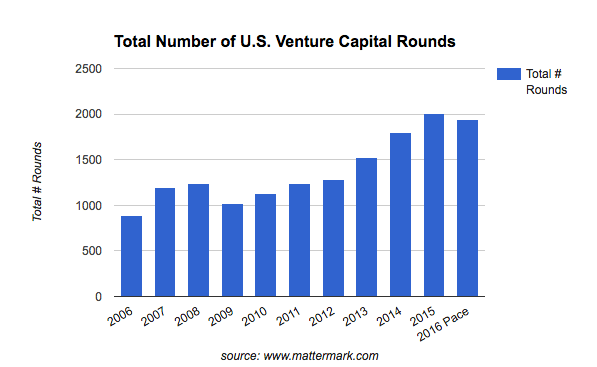
2016 Venture Capital Activity: Deal Volume Down 3% YoY
While 2016 capital deployment is trending to be off the 2015 high—hence our “2015 was the local maximum” headline—the change is not a dramatic directional shift. It’s really more of a pause to look around at the top of the mountain, which seems to fit well with VC’s post-election (and pre-Federal Funds rate adjustment) “wait and see” sentiment at the moment.
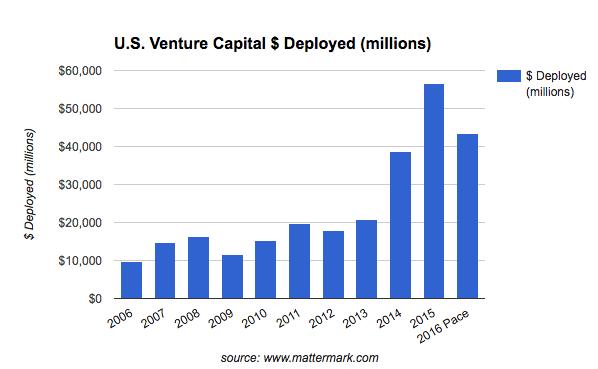
2016 Venture Capital Activity: Fund Deployment Down 23% YoY
While the number of deals shown above is trending down just slightly, we see the trend for a pullback in capital deployment versus 2015 levels is more pronounced, with a decline on pace for -23% compared year-over-year. As our first graph showed, this is the strongest indicator that valuations are in decline and the bar to clear for getting a deal don has been raised. This is what a “flight to quality” in VC portfolio construction looks like.
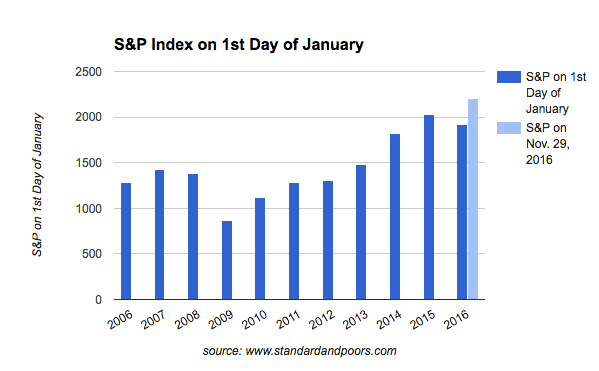
The S&P 500 Is Not Down YoY
It’s almost like there is a 6-9 month lag in the relationship between public markets and venture capital… because the S&P 500 just keep chugging along. Despite the generally negative reaction to the election in Silicon Valley, fears that the market would tank if Trump was elected have been unfounded so far.
What This Means For Founders Raising Money Now
It’s never easy raising millions of dollars for unproven and unprofitable startups, but this is still the 2nd best year in the past 10 years to do so. Get back to work!
Interested in the underlying data used to compile this report?
Current customers can use Mattermark’s historical funding rounds to search, filter, and export data for analysis. If you’re not a customer yet check out our plans and pricing, and sign up to try Mattermark completely free for 14 days.