tl;dr: After a long run, global macroeconomic uncertainty prompts Series A investors to take a breather.

Series A investment trends can provide a good approximation of the health and sentiment of the startup venture capital market. It’s common sense: When times are good, early-stage equity is enticing. When the future is uncertain, more conservative assets are prized.
Earlier this week I revisited a prior Mattermark piece that tracked the pulse of Series A deal performance during a time when the stock market was on the rise, volatility was low, and investors were hungry. As I noted in the piece, a lot has changed in the past year. In terms of dollars invested and number of deals, for example, Series A activity declined when comparing the second quarter to the first.
What is driving the current change in Series A investment, compared to the preceding quarter, or our prior coverage? Let’s see if we can find out.
Up And To The Right
Series A investment increased at a quick, and fairly consistent pace between 2011 and the end of 2015. Mattermark suggested in its original piece that the rise in Series A investment was a related, if lagging, indicator of investor confidence in the wake of the Great Financial Calamity of 2008.
Between the first quarter of 2011 and its peak in Q2 2015, median Series A deal size grew by over 70%. And, the number of Series A deals more than tripled during a similar time period, from 160 deals in the first quarter of 2011 to 485 in Q1 of 2016.
Here’s the critical chart:
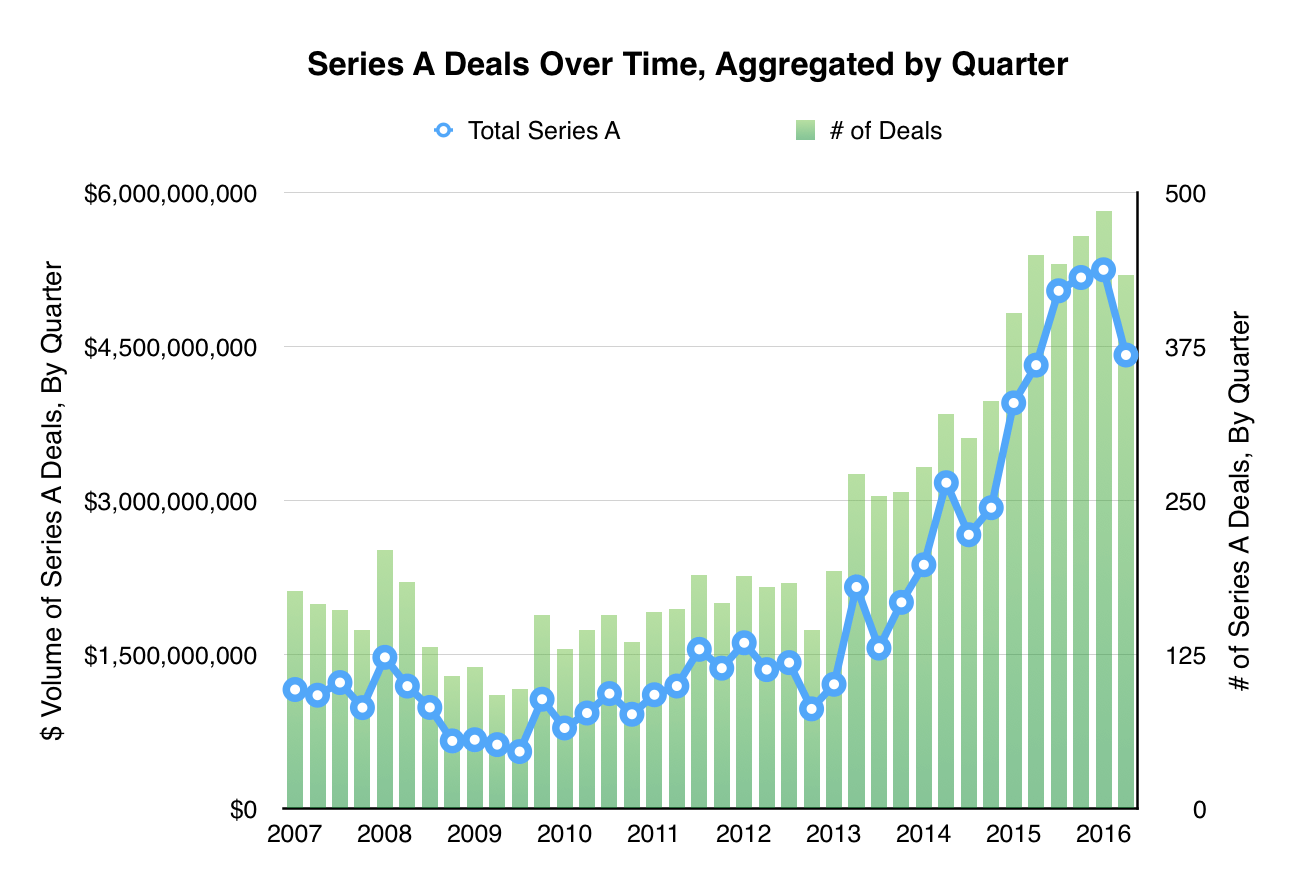 The boom in Series A investment since 2011 was very real, and at least up until early August 2015.
After more than a year’s worth of quarters that saw consecutive increases to the total dollars invested in Series A rounds, last quarter stands out as a double negative. What changed? To understand, we have to rewind the tape to August of 2015.
Hello Uncertainty, Our Old Friend…
Mattermark’s original piece was published on August 4, something that in retrospect was an unfortunate timing. On August 18, less than two weeks later, the Dow Jones Industrial Average posted a 33 point loss. What followed was a wave of selloffs that intensified the following week.
Over the next few trading sessions momentum gathered, culminating in a 588 point plunge on August 2. What came next? Worries about Chinese growth, uncertainty relating to what the Fed might do, the Greek debt crisis, and precariously low oil prices.
Startup investment is impacted by public markets. If public markets take a pummeling, startup investment will likely follow suit. To take that mostly-accepted truism and extrapolate it out a bit, when fear rises in the public markets, private investors act more conservatively. Keep in mind our opening line concerning when early-stage equity is most attractive.
The following chart shows the Volatility Index, usually called the VIX, over the past year or so. The VIX, or “fear index” did something notable just a few days after that first Mattermark entry:
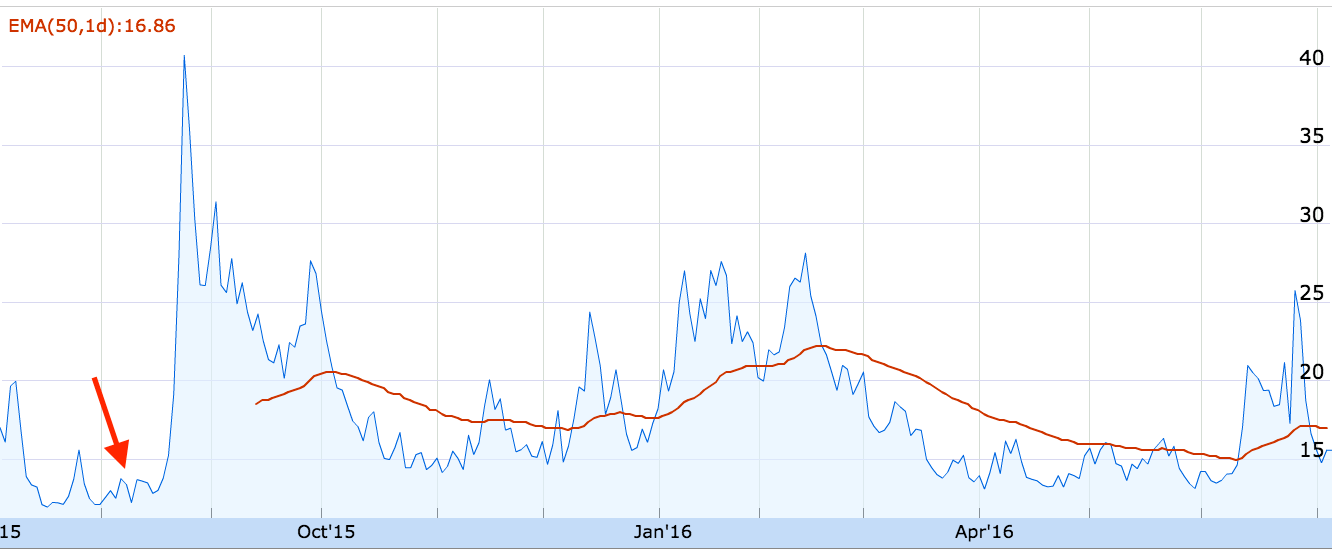
To correlate the two charts, the dramatic rise in the VIX can be linked to the fourth quarter of 2015 and the first of 2016 posting lackluster increases to aggregate Series A investment. VIX spikes in the first quarter likely helped break the back of the long Series A bull cycle, leaving us with a disappointing second quarter result. There is lag between when a deal is executed, and when it is announced; there is also lag between when the market changes, and when those shifts show up in trailing venture capital reports. As such, we do not correlate one quarter’s VIX change to that quarter’s venture capital results, as we’d likely be looking too early.
Series A Deals Through Time
After discussing what has changed, it’s worth keeping in mind what hasn’t. The original Mattermark post discussing Series A trends found that the mean A deal in terms of dollars invested was higher than the median. That’s unsurprising given statistical outliers on the high end.
The trend has not only continued, but perhaps even expanded in recent quarters:
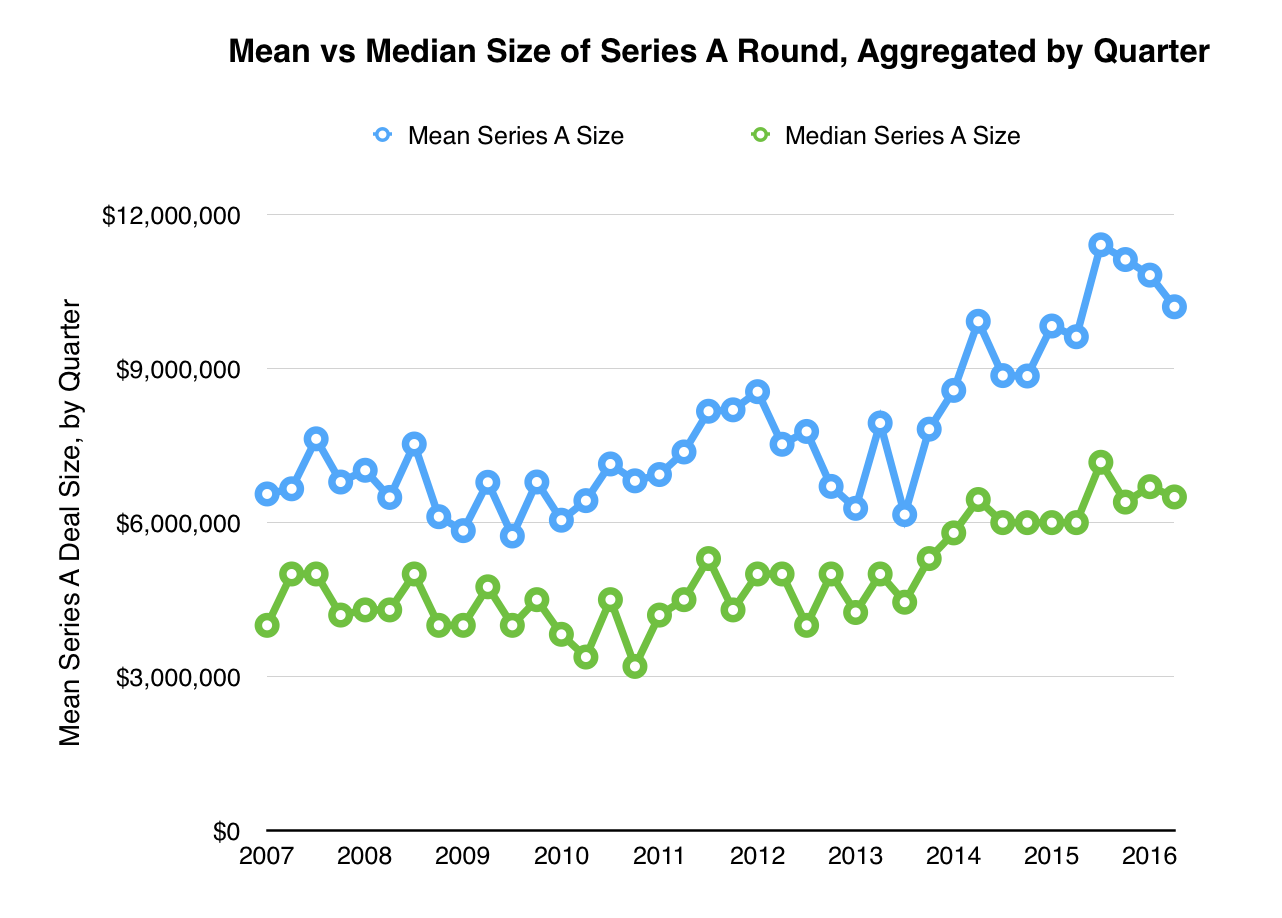
Why has the median and mean Series A round size grown from 2012 onward? The explosion of so-called “micro VC” funds helped make cheap capital available to very early-stage companies. That may have pushed traditional A rounds back in the startup funding cycle. If seed-stage investors are willing to fill the role that Series A investors once occupied, the trend could be partially responsible for the increase in the size of a common A deal.
Down, but not out
Investment in Series A-stage startup equity has had a very good run over the past several years. However, no market is an island. For now it seems like investors are trying to keep the powder dry, waiting for this latest batch of financial crises to blow over. In the meantime, though, it still looks like business as usual, just a bit slower.