tl;dr: The dramatic repricing of recurring revenue has stopped, even rebounding slightly. However, that might not help your favorite company as much as you hoped.
Annual recurring revenue (ARR) has become a key objective for modern startups. Investors and founders alike love the stuff, as it is predictable, quantifiable, and often provides software startups with strong gross margins.
However, over the past several years the value of a single dollar of ARR from a software company that sells its wares on recurring basis—a software as a service (SaaS) firm—has declined dramatically from the highs set in 2014.
As Mattermark reported in March, the value of a dollar of ARR for public SaaS companies fell from a multiple of 7.7x in early 2014 to 3.3x in early 2016. That repricing of a revenue varietal that many companies had raised and spent against led to delayed IPOs, cost cutting, and other measures that, for a time, were considered either jocosely or draconically conservative.
As ARR repriced in the public markets, sharp cash burn generated by private companies looking to grow their own recurring incomes lost its luster. The burn-at-nearly-any-cost mantra quickly became partial anathema. However, things are looking up, slightly new data suggests, so stop frowning.
Is the valuation carnage among SaaS companies over? Perhaps not entirely. Let’s take a look.
3.7 > 3.3
As noted above, forward revenue multiples for ARR among public SaaS companies fell from 7.7x to 3.3x, landing at the lower figure during the first quarter of 2016. However, new analysis of the same data set shows something different: A modest improvement.
Venture capitalist Phil Orr created a new chart showing a modest rebound in forward ARR multiples that brings the figure up to 3.7x, up from their prior lows. From his Medium post:
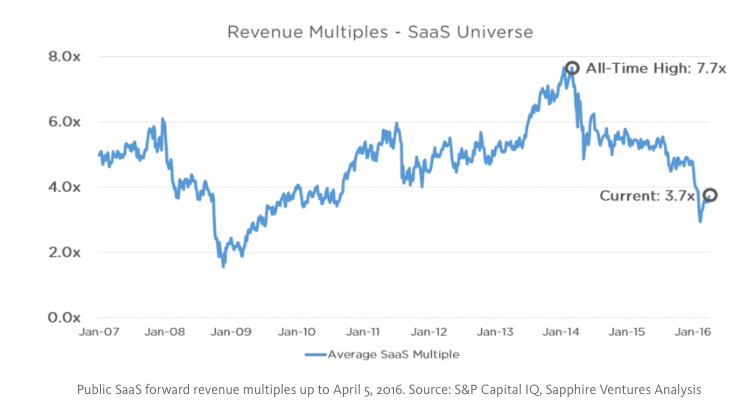
A few observations: Drink in how valuations in what Orr calls the “SaaS Universe” were impacted by the financial crisis. And observe the five dramatic declines recorded—seeing ARR multiple compressions on a regular basis should be expected, not surprising.
But we need to take the general and apply it to the specific, so let’s take another whack at our recurring test subject: Box.
ARR Repricing In Practice And Action
I’ve noticed over the past year that Box often beats investors expectations in its earnings reports, for which it is rewarded with lurching declines in its share price. Box also regularly tacks on improved guidance to its trailing performance.
It was a puzzler. Better than expected results, improving guidance, and steady guidance for a path to cashflow breakeven all seemed to indicate that Box was creating value. That its share price remains stuck below its offering price was difficult to understand. What I consistently failed to take into account was that Box was beating expectations set at certain, prior implied ARR multiple. During the ensuing quarter, that multiple had changed; as Box grew its ARR, public investors were downsizing the value of that exact product at a quick clip.
Call it headwind.
In our last checkin on the value of ARR, Box was worth around 4.4 dollars per dollar in ARR that it created (calculated from its last fiscal quarter at the time). Box’s most recent earnings report gives us another set of data. Today, Box is worth 4 dollars per dollar of ARR that it currently generates1. That decline is a function of Box growing its revenue and taking a shellacking from investors after its reported billings came to light.
But while Box is delivering on its expected performance—its improved guidance for the year this quarter appeared more cosmetic than material, to be fair—it is now likely trading inside the range of normal ARR multiples. That means that after being repriced on a number of occasions—including during its IPO—the company may now be in line with market norms. Whether or not that is bullish is up to you. It can be argued either way.
Why Is This Happening?
If the value of ARR took it on the chin, and has now recovered slightly, we must ask why.
As it turns out, at least one potential lever of change isn’t too hard to find. A recent post on TechCrunch written by venture capitalist Rory O’Driscoll recently made a notable argument:
“For SaaS companies, which is the area I invest in, the simplest and most accessible measure of customer profitability is Sales Efficiency, the ratio between quarter on quarter revenue growth and the sales and marketing costs required to generate that growth. The chart below displays the median Sales Efficiency for all public SaaS companies from 2012 to 2015 YTD.”
The promised chart:
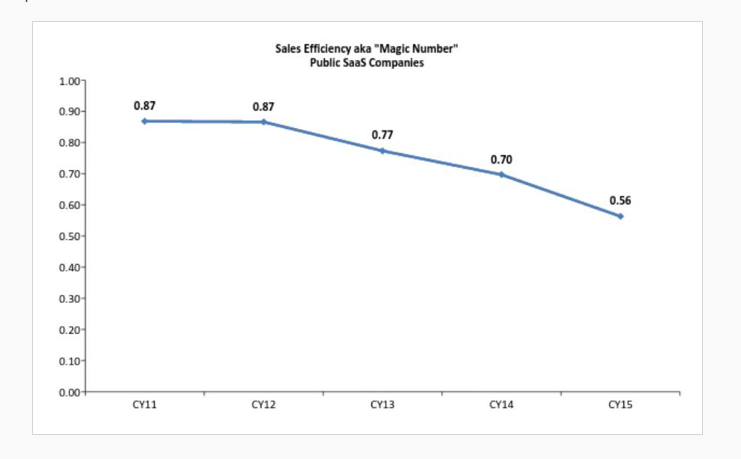
In case you aren’t hip to all the Cool Kid SaaS Slang terms, that’s not a rosy chart. It implies the ratio of sequential quarter revenue growth compared to the costs required to create that growth is worsening. Less revenue growth compared to cost. You can skew the first variable down, the second variable up, or both, depending on the company you are considering.
There are other answers, including potential investor fear that SaaS companies will require more cash to reach profitability at the same time that markets are becoming more conservative. Put more simply: VCs are predicting that increasing SaaS spend competition will lead to a higher floor on sales cost for recurring revenue, forever.
What matters is that, for now, public SaaS ARR multiples have halted their decline and have even recovered slightly—12.12 percent to be exact. For private companies that currently are valued at much higher ARR multiples, all that is required to avoid a down round is top-quartile or decile growth.
No pressure, of course.
- As with nearly every example of ARR in public companies like Box, we are mixing in some other forms of revenue which skews our numbers slightly. However, for nearly pure SaaS shops, the difference is slight, allowing us the space for directional analysis without getting our shoelaces tied together.