
Sean Ellis, CEO of GrowthHackers, and Morgan Brown, COO of Inman News, launched a new book today called Hacking Growth: How Today’s Fastest-Growing Companies Drive Breakout Success, from Crown Business. It’s slated as, “The definitive playbook by the pioneers of Growth Hacking, one of the hottest business methodologies in Silicon Valley and beyond.” Below is an excerpt from the book that tells the story of how Josh Elman, former Product Manager at Twitter and current Partner at Greylock, figured out that following 30 people was a growth driver at early Twitter.
Putting It All Together
To illustrate how identifying growth levers, conducting in-depth analysis and reporting, and supplementing it with customer queries can be used to unlock and then optimize an opportunity for growth, let’s look more closely at the way Josh Elman and the growth team at Twitter discovered that people who were following at least 30 other users became avid, long-term fans. Elman made an initial discovery by doing what’s called cohort analysis, which is dividing your customers or users into distinctive groups by a common trait. For Twitter, a basic division of users might be by the month they joined the service. This can be determined fairly effortlessly, but with a large and detailed data cache, you’d be able to create much more refined cohorts, such as people who look at Twitter up to five times a day but never tweet, people who tweet only on weekends, people who add ten or more new followers a week, and so forth.
At the time Twitter’s problem was retention of users; lots of people were signing up but then leaving, while at the same time a much smaller group were becoming quite active. So Elman and the team started by dividing up users into cohorts based on the number of days they visited Twitter in a month. Then they compared the number of visits made by those same users for the next month. They made a striking discovery: those who visited at least seven times in one month were retained in the next month at a very high rate, between 90 and 100 percent.
Retention Rate Based on Times Used in Month One
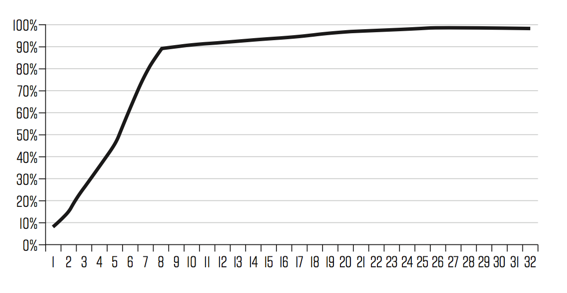
He then divided users up into three cohorts: core users, who visited at least seven times a month; casual users, who visited less often; and cold users, who never came back after a first visit. That allowed the team to determine that only 20 percent of those who visited became core users. So the team dove into the data further, conducting a correlation analysis, which looks for any similarities of behavior within one group of users that are not found in other groups. The analysis of the highly retained users who came back at least seven times a month revealed that these people were generally following a number of other users that hovered around 30; some were following many more, but 30 seemed to be a “tipping point” number that hooked people to coming back for more.
But Elman and the team didn’t stop there. They knew that, as the mantra in statistical testing goes, correlation does not equal causation. Now, at that point they might have started just trying to boost the number of people that users were following and left it at that. And indeed that might have produced appreciable results. But what if the sheer desire to follow a significant number of people wasn’t the underlying reason that following 30 people made the product sticky? So the growth team dug further into the data and soon found another correlation. Whether or not people became active users also had to do with how many of those 30 or more people they were following were following them back. But contrary to what you might expect, it wasn’t that the more people followed a user back, the more likely they were to stick with Twitter; rather, those who were being followed by just a third of those they followed were the ones who became loyal users. But why? Here’s where collecting insights by interviewing Twitter users came in. By calling users and interviewing them the team discovered that if much more than a third of those you were following were following you back, then Twitter seemed pretty much like just another social network. The distinctive value of the product wasn’t clear. If less than a third of the people you were following were following you back then Twitter seemed more like a news site, of which there were already a plethora of other options. The unique product value of Twitter as a place for people to find out what’s happening in their world became clear to people when they had the one-third to two-thirds ratio.
The team also used interviews to learn about the behavior of another distinctive cohort of users: those who had gone “comatose,” disappearing for a time, and who then suddenly return and become active. By actually picking up the phone and calling these people, the team learned exactly what was going on: when these people had first started using Twitter, they had thought of it as mainly about sending tweets, as a form of broadcasting, especially for promotional purposes. They didn’t have an interest in that, and so they checked out. But then someone they knew had told them about someone they were following, maybe a celebrity or someone they respected in their career or community, and these Twitter refugees realized the value of the site as a tool for connecting with and learning from others. The conclusion was clear: the number of people following and being followed by a user was the key lever they would need to focus on to drive growth. And they used this information to further refine their ways of suggesting people for users to follow.
As the example from Twitter shows, identifying your growth equation and the key metrics to improve, along with establishing the proper instrumentation, data collection, and reporting that includes customer feedback, to discover and monitor your core growth levers, is an essential and powerful first step for successful growth hacking. Now you are ready to put your growth engine in motion. It’s time to introduce the step-by-step process we’ve developed for: honing the best set of ideas to test; getting tests done as efficiently as possible; running a highly disciplined growth meeting; and keep learning from and building on your findings in order to kick your growth engine into high gear.
This is an excerpt from the new book by Sean Ellis, CEO of GrowthHackers, and Morgan Brown, COO of Inman News, from Crown Business, Hacking Growth: How Today’s Fastest-Growing Companies Drive Breakout Success, which launched today.