tl;dr: We’re taking a look at the network of startup M&A around the world.

Mergers and acquisitions (M&A) is an integral aspect of the startup ecosystem. It is one of two major paths to liquidity for investors, and acquisitions give big companies the opportunity to obtain new technologies or executive talent. We set out to map the world of global startup M&A.
In order to chart the world of startup M&A, we pulled the complete list of acquisitions that occurred around the world since January 1, 2015. In the past twenty months, there have been nearly 8,700 acquisition events1 in over 90 countries that are recorded in Mattermark’s dataset. Some initial takeaways:
- Nearly 45% of cross-border M&A flows into the United States.
- In the global network of M&A, power and influence is highly concentrated in the USA.
- In Europe, Great Britain is the biggest buyer of startup companies, but Scandinavian countries have the highest average rate of acquisitions when controlling for population.
- The overwhelming majority of countries lose many more companies to foreign acquisition than they take in, creating a net negative trade balance for them.
Of the acquisition events we analyzed, roughly 4,100 acquisitions were sourced domestically (a company based in Germany acquired another German company) and 2,250 deals were made across international borders. As far as the international M&A trade is concerned, the status of the remaining 2,300 deals is unknown.
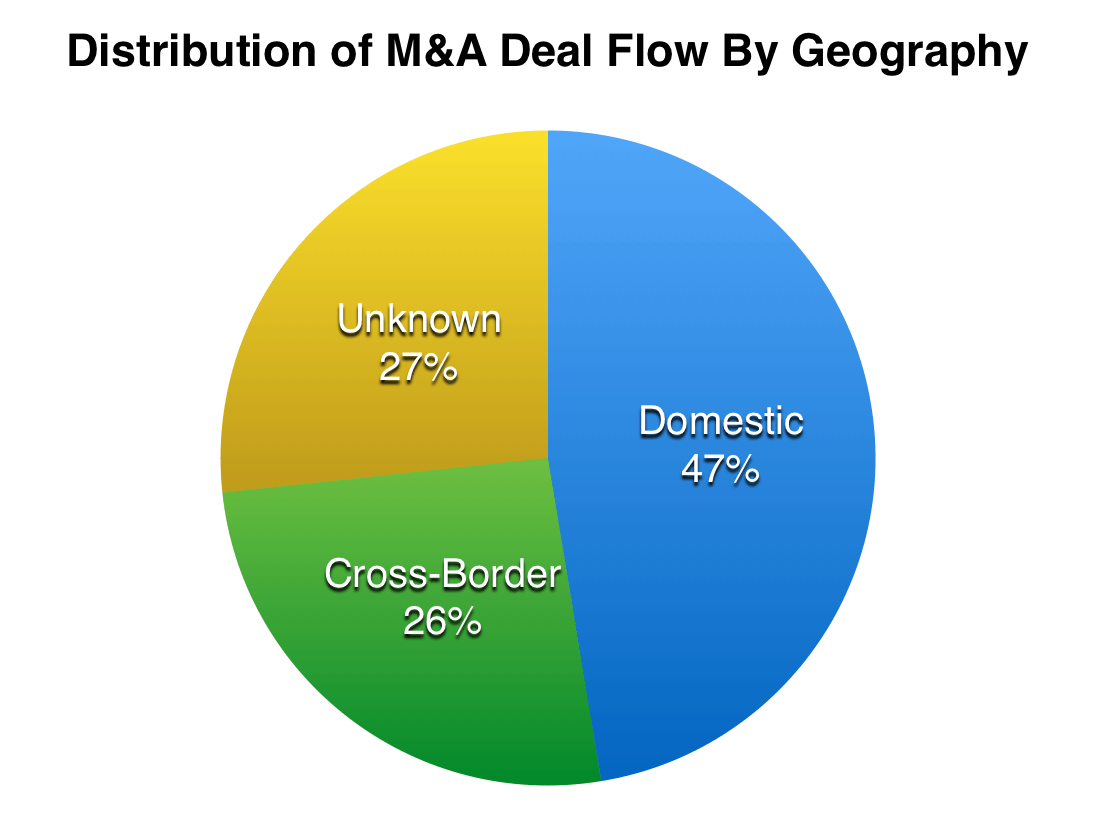
In broad strokes, around the world, M&A is mostly a domestic affair. But the fact that a full third of the deals are cross-border is worth noting.
Mapping the Global Startup M&A Network
We took all of the cross-border acquisition data and fed it into Gephi, an open-source network visualization tool, and displayed the resulting network using the built-in ForceAtlas algorithm. This helps to show just how centralized the international startup M&A market is.
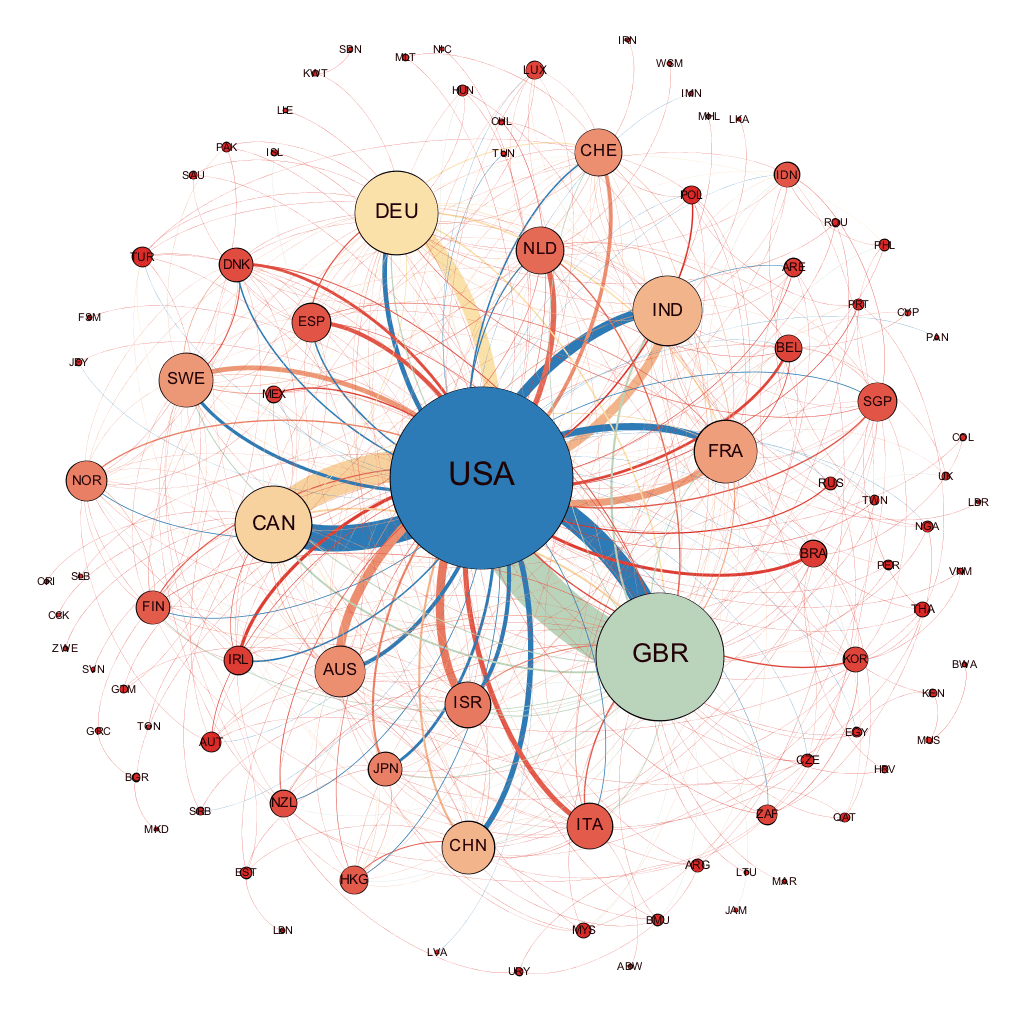
There is a lot going on in this image, so let me explain:
- The size and position of nodes (i.e. the circles) in the network. Nodes in the center of the graphic are more central to the network. Bigger nodes are more connected than smaller nodes. Each node is labeled with the standard 2-3 letter NATO country codes.
- The color of nodes in the network. The color of nodes is a function of their “indegree,” which is, in this case, the number of M&A deals that are coming into the country from other countries. Nodes with cooler colors (such as the dark blue of the USA and the light green of Great Britain) have the most inbound international M&A deal flow, whereas dark red nodes have very little or no inbound M&A.
- The color and thickness of edges (i.e. the lines connecting the circles) in the network. Edges are the color of their origin node. For example, the dark blue line connecting the USA to Great Britain shows the relative flow of companies out of the US and into Britain, whereas the light green line shows the relative flow of companies from Britain into the US. The fact that the green line is thicker than the blue one shows that Britain sends more companies to the US than the US sends across the pond.
With that quick primer out of the way, we can make some general observations:
- The network takes on a very sparse hub-and-spoke structure (d= 0.055), with most of the connections being made between the USA and peripheral nodes.
- There aren’t many strong ties between other nodes besides the USA, indicating a high concentration of economic power at the center of the graph. At least in this dataset, the US is most often the alpha and omega of startup M&A. (For the network analysts and fans of linear algebra in the audience, the USA’s Eigenvector Centrality is 100 in this directed graph.)
- Of the countries the USA exchanges with most, the “balance of M&A trade” is roughly even between the USA and Canada, France and India. In other words, US companies buy roughly as many companies from those countries as those countries buy from the USA. There probably isn’t an overarching reason for this parity, but it’s interesting to note nonetheless.
Ranking Countries By Inbound M&A Activity
Although viewing startup M&A through a network theory lens might produce some pretty visualizations of the big picture, nothing really beats a good old fashioned ranking.
Here are the top-ten countries ranked by the raw number of foreign companies its business communities acquired since January 1, 2015.
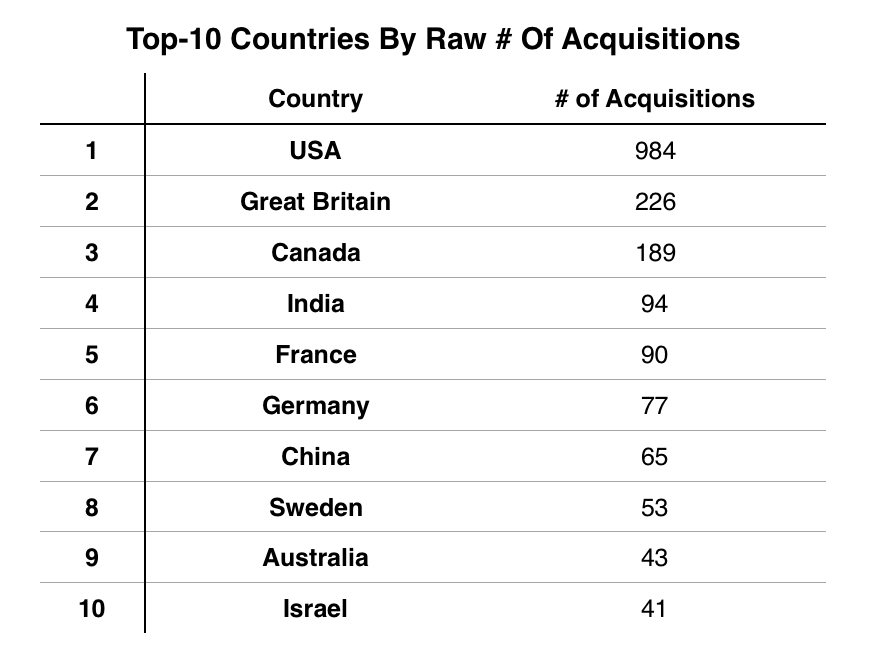
There are no real surprises here. Just like we showed in the network visualization, most of the inbound M&A activity happens in a small handful of countries, with the USA, Great Britain, and Canada accounting for the majority of deals.
Of course, this ranking heavily biases big countries with lots of international connections. So here are the top-15 countries as ranked by the number of inbound acquisitions per one million people living in the country.
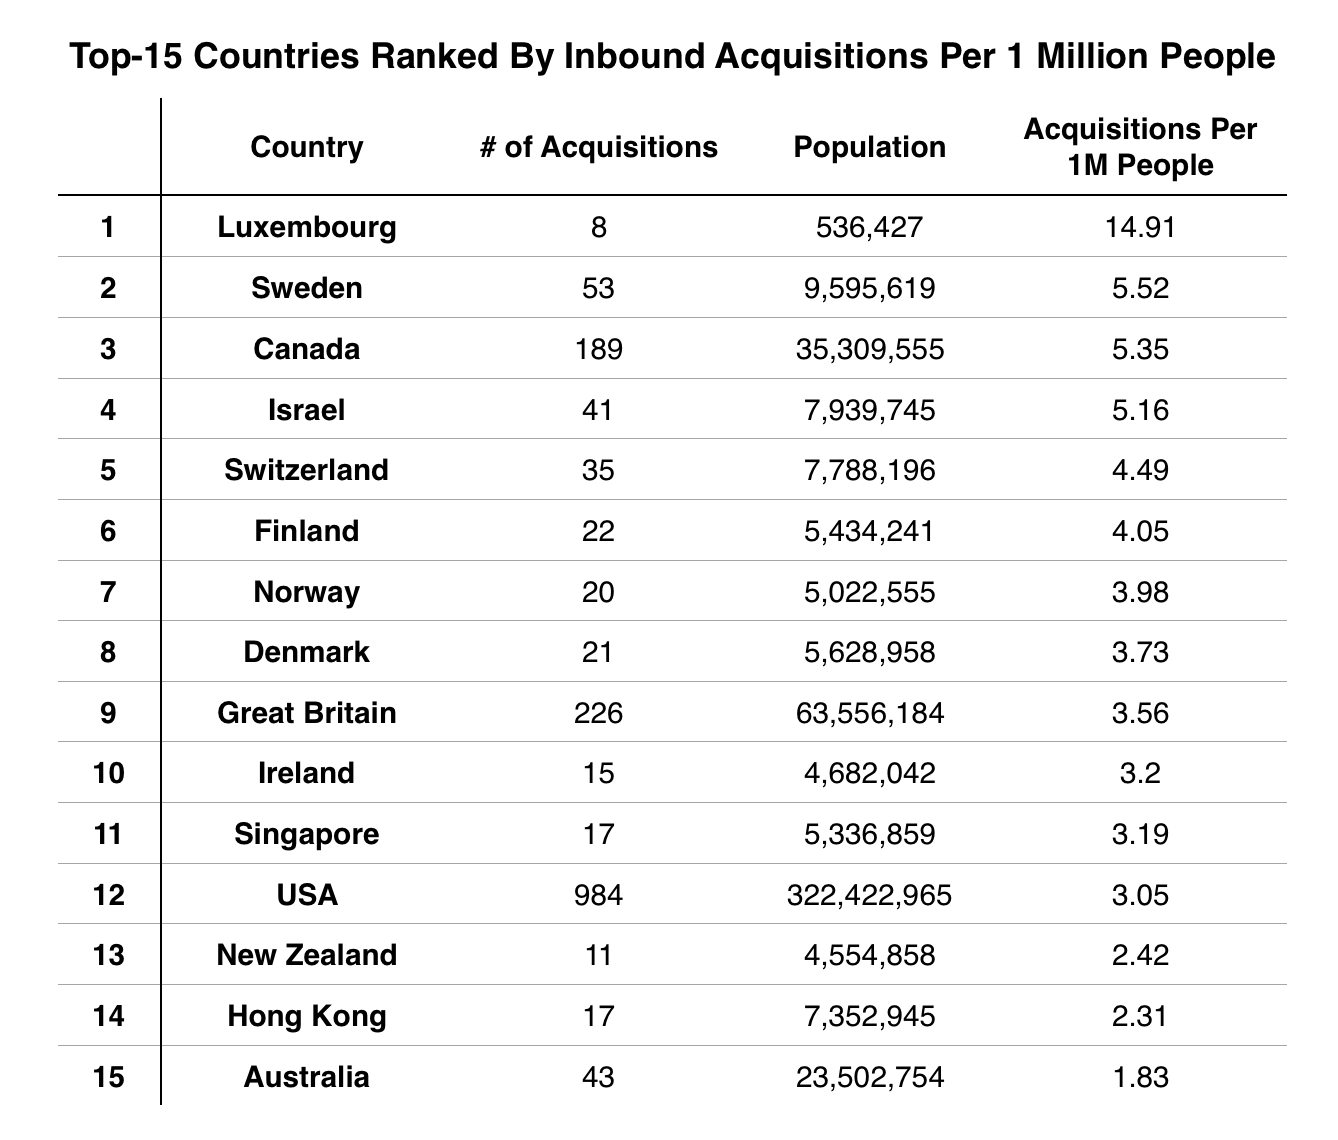
Tiny little Luxembourg—with less than 1,000 square miles of territory wedged between Belgium, France, and Germany—is definitely an outlier here. It’s certainly the smallest in terms of its GDP or population. Moving slightly down the list, we find that Scandinavian countries are very well-represented in this ranking, as are other European countries. In general, these countries are punching far above their weight when it comes to inbound M&A activity.
There are three additional points that stand out in this analysis:
- The sheer size of the US’s population keeps it out of the top 10.
- Only Hong Kong and Singapore make it on the list—despite economic powerhouses like China, Japan, and South Korea. This is probably because of the relatively small populations in Hong Kong and Singapore.
- Israel is the only Middle Eastern country on this list. This is no surprise. Israel’s startup ecosystem is growing rapidly and specializes in the kind of high-tech and security-focused innovation that American companies actively seek out.
Between the World and US: Sources and Destinations of International M&A Deal Flow
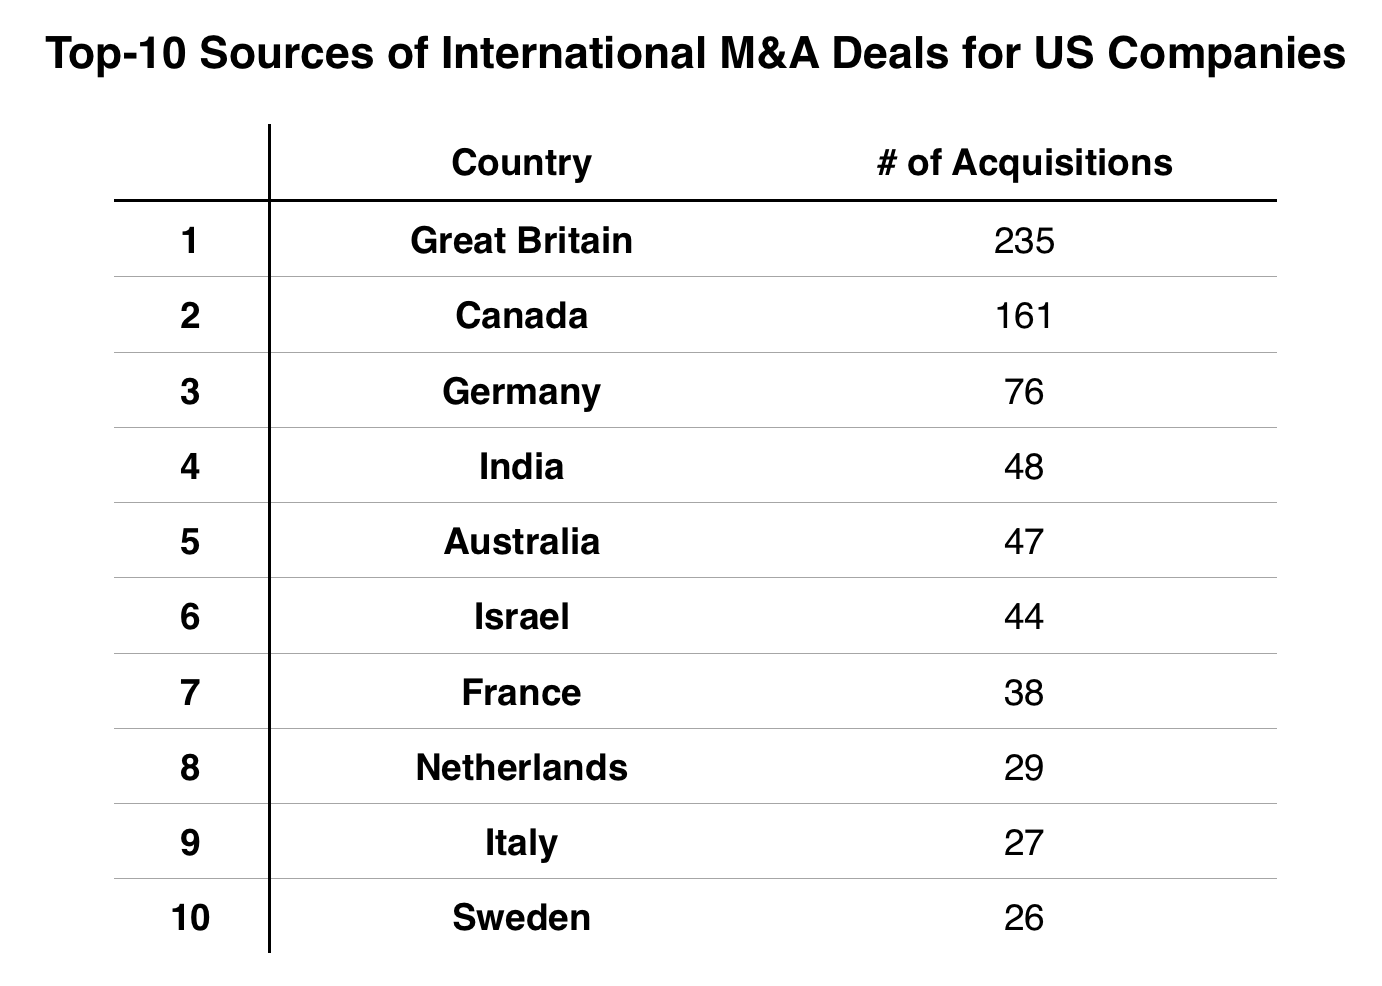
We’ve looked at the network of international startup M&A from a global perspective, but what about something closer to home for us? Let’s say you’re a hot-shot corporate development person at an American company that’s eager to acquire some new technology. If nothing in the US passes muster, then here are the top ten most likely places where your next acquisition is going to come from:
On the flip side, let’s say you run a startup here in the US, you’re open to living in another country, and you’re actively looking to sell your business. Chances are, if your startup is acquired by a foreign company, you will most likely end up in one of these ten countries:
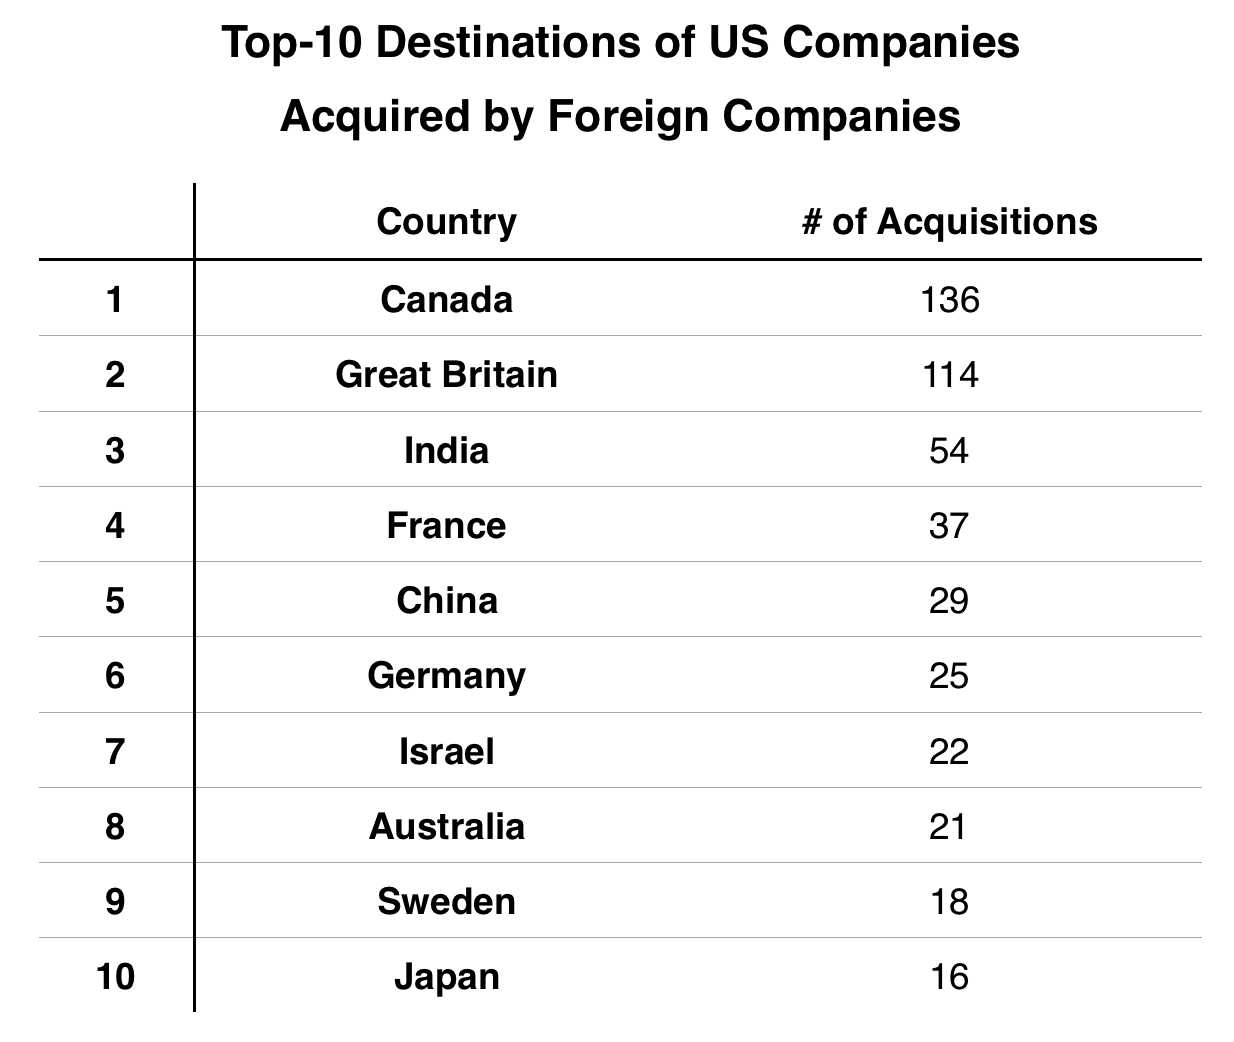
In this ranking, by the raw number of acquisitions, we see the usual suspects: Canada, Great Britain, Israel, and a small handful of EU countries. Although Japan now makes the top-ten list here, it’s not by much. Japanese companies may have acquired 16 US companies, but twelve went the other direction. A real disparity exists with China, which acquired over twice as many US companies as American companies bought from China. Basically, we export more companies to China than we import.
In a slightly ironic twist, the startup M&A trade deficit between the US and China favors America.
International Startup M&A in Perspective
What have we learned here? The international startup M&A network is a sort of skewed, more US-centric version of the broader international trade network. In regular international trade, America’s biggest trading partners are the European Union, Canada, China, Mexico, Japan, South Korea and Brazil, in that order.
Similarly, the majority of trade in upstart companies is done with these countries. Over one-third of the international companies acquired by Americans come from just two countries: Canada and Great Britain. Over 50% of the American companies acquired by foreign companies end up in Canada, Great Britain, and India. Unlike conventional international trade, deal flow in the international startup M&A market is much more concentrated, proving, once again, that the startup ecosystem is at once a microcosm of the global economy and somewhat detached from it.
- A quick note on the data: In the interest of using the largest dataset possible to perform our analysis, we did not filter the roughly 8,700 deals by sector or age of the company. There are some pharma, hardware, and more traditional companies in the mix, but in general, the dataset skews toward tech and earlier-stage companies.