tl;dr: What does the average Series A round in the world’s biggest economies say about their startup ecosystems?

Most of us know some version of the story. On an October night in 1872, some rich bachelor in London named Phileas Fogg is bet £20,000 (~£1.6 Million today, just a bit larger than the average Seed round in 2015) that he can’t travel around the world in eighty days.
The result: a rollicking adventure through Egypt, India, Hong Kong, Japan and the United States that captivated readers of Jules Verne’s 1873 novel. Well, from the safe confines of a coffee shop in Chicago, I hope to use global startup funding and economic data to take a tour of startup ecosystems in some of the world’s biggest economies. And, with luck, this journey will be made in fewer than eight minutes.
Before striking out on this metaphorical journey, it’s probably best to plan our trip. For the sake of brevity, and to stay true to the title of this article, we’ll explore patterns in Series A deals in the world’s eleven largest economies ranked by GDP and adjusted for Purchasing Power Parity (PPP) over the past few years.
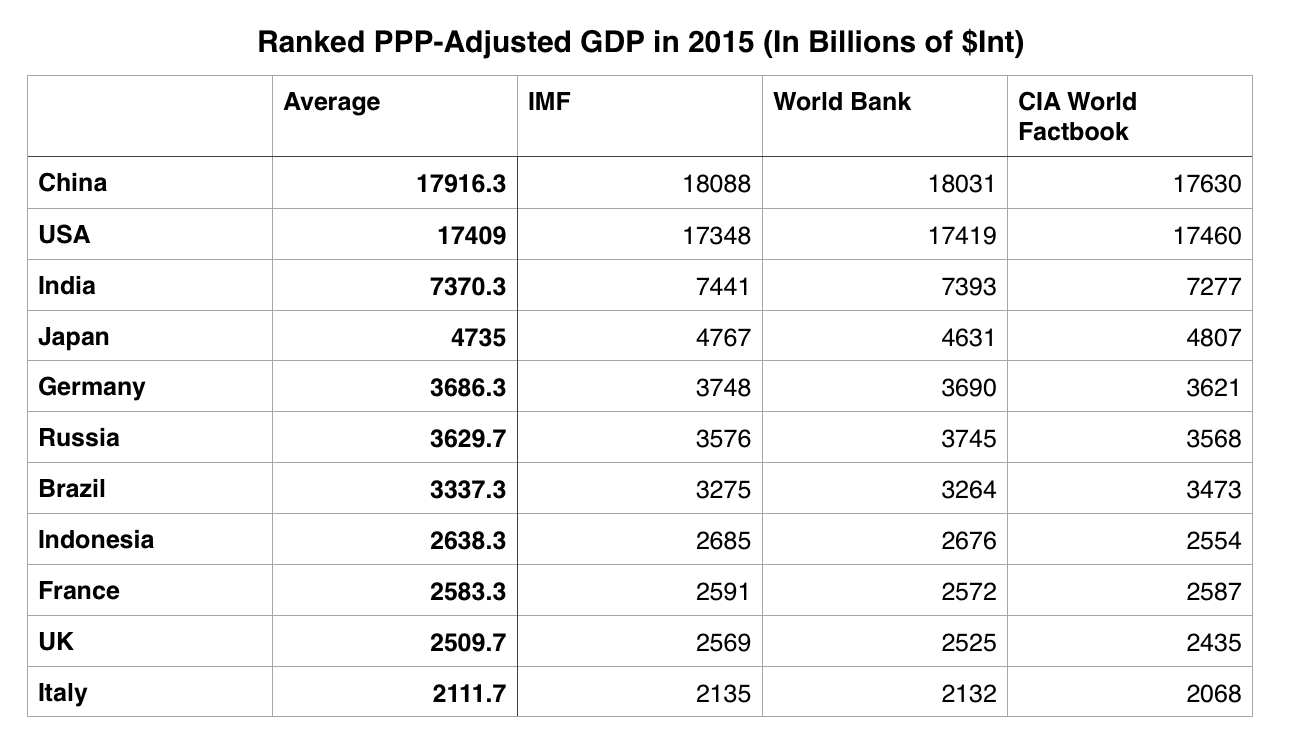
The Eleven Largest Economies (By PPP-adjusted GDP)
By looking at the eleven largest economies, we have the opportunity to compare the United States—which has consistently had the top-ranked nominal GDP since the turn of the last century—against the next ten largest economies.
The most recent complete GDP dataset is for 2014. There are at least three agencies that report GDP figures—The World Bank, International Monetary Fund, and the CIA’s World Factbook—and each of their calculations vary slightly for reasons too wonky to explore in depth here. (Note: Italy and Mexico have basically the same PPP-adjusted GDP, but Italy is better represented in the dataset, so we’ll call Italy #11.)
I average the GDP statistics cited in each report to come up with general PPP-adjusted GDP figures and relative ranking for each country. (Figures are in Billions of $INT)
Gathering And Processing Raw Data
I pulled data for Seed and Series A rounds in each country between January 2012 and December 2015. I find that Mattermark’s dataset has the deepest investment data for companies based in the USA, but most of the other largest global economies are well-represented in their data.
For the sake of transparency, here’s the number of rounds I gathered for each country for each year I wanted to analyze. These figures represent the total number of Seed, Angel and Series A deals sampled for each year, not just the Series A deals.
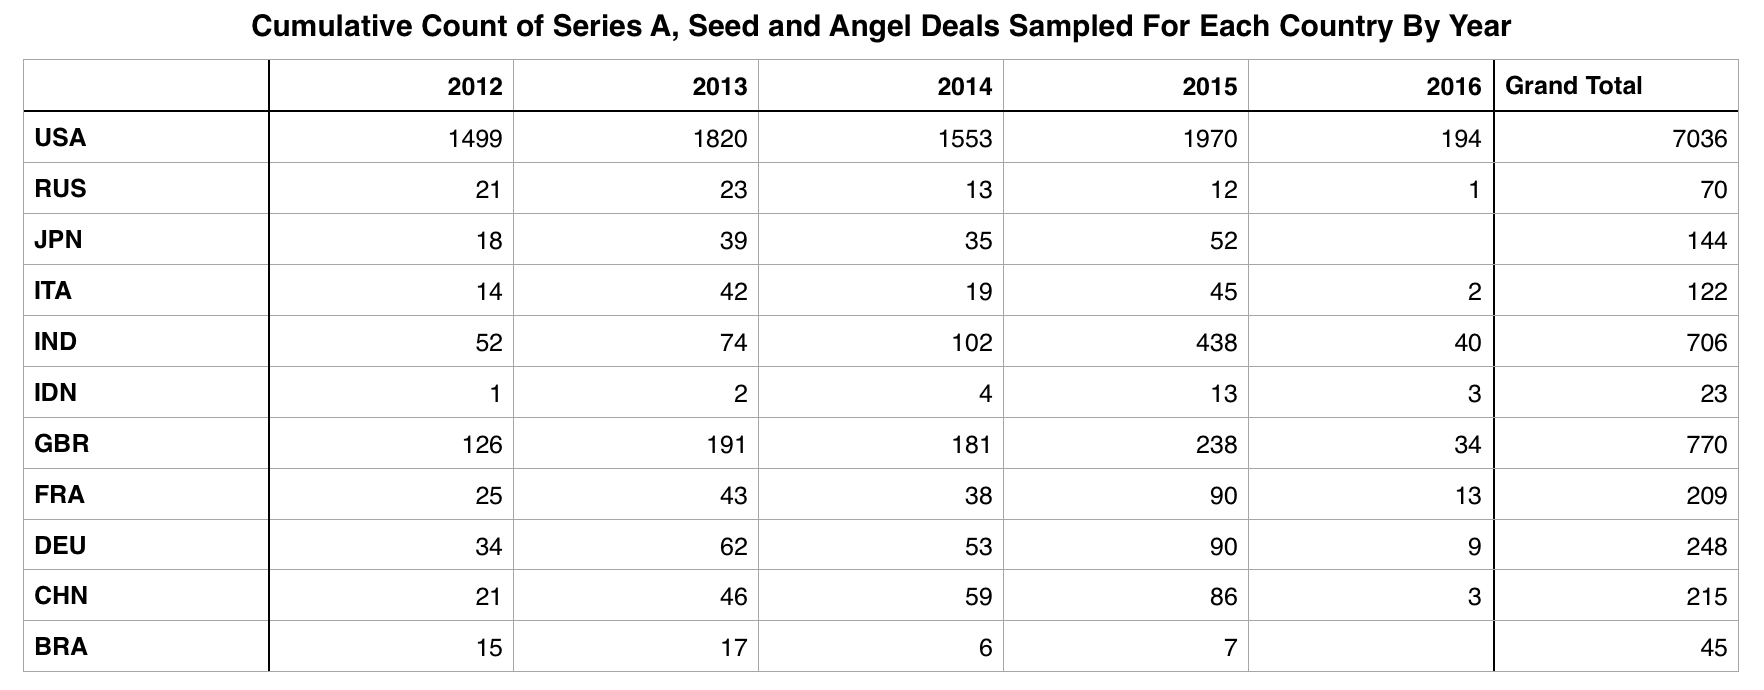
In a final note about the raw data gathered from Mattermark’s dataset, some of the rounds were priced in foreign currency. Using foreign exchange data from Oanda, all deals in this analysis are priced in USD at the approximate exchange rate when the deal occurred.
What Does The Data Say?
In a Time of Big Checks, China is King
Before examining funding trends over time in greater depth, let’s first start with a chart displaying the average series A funding round in two different “time buckets.”
In the chart below, the blue bars represent the average Series A deal made between January 2012 and December 2014 in each of the countries in our sample set. Red bars represent the average size of those deals made between January 2015 and early February 2016.
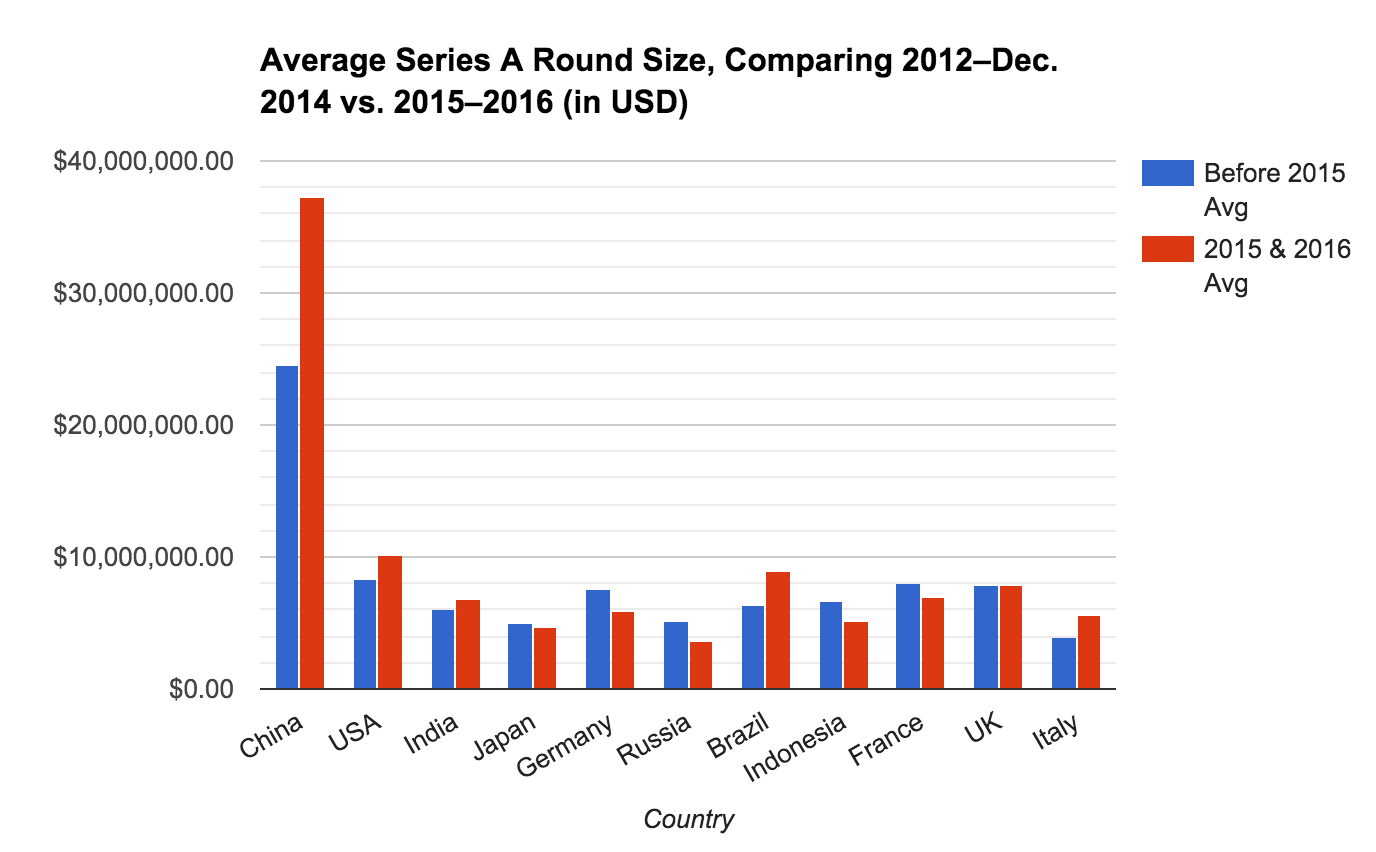
Note before continuing: Indonesia’s pre-2015 average is artificially high due to one $36.5M A round and a relatively small sample size. Without Elevenia‘s round, the average Series A round in Indonesia would be ~$1.5M in the period between 2012 and Dec. 2014.
Let’s first discuss the elephant in the room, namely the fact that the average Series A round for a company in China in 2015 stands head, shoulders and the better part of a torso above the funding rounds in other countries in our sample. From the perspective of a Chicagoan, where the average Series A round is ~$5M (Uptake’s October, 2015 $45M A round notwithstanding), the $8-12M rounds that are a seemingly everyday occurrence in the Bay Area are impressive.
Now, one might argue China is a big place (it certainly is) and, in such a big economy, having over twenty Series A funding events of over $50M is to be expected. However, what might not be expected is the sheer scale of Series A deals made with a handful of Chinese upstart companies. Some of these include: a $300M round for 58.com subsidiary 58 Daojia from Alibaba, KKR and Ping An Group; $100M for Shanghai-based operating systems producer Acadine Technologies, founded by former Mozilla executive Li Gong; and, the pièce de résistance, a $483M investment in fintech company Lufax by BlackPine Private Equity Partners, CDH Investments and venture investment bank CICC.
In the US, this scale of private financing is the norm for late-stage, highly successful companies of Uber or Airbnb’s scale and vintage, but it is largely unheard of in companies less than two years old. Back in the heady days of the first Dot-Com Bubble, it wasn’t uncommon for companies to go public soon after being founded (sometimes before they even had a product in the market), but that’s the US in the late 90’s. 2014 and 2015 brought a lot of volatility to China’s stock market and some have noted, including WSJ’s Mia Lamar, that the the tech IPO market in China is fairly weak. Although it’s tempting to cry “Bubble!” when you see numbers like $400+M for a Series A, investors in private Chinese tech companies may be acting rationally by not exposing themselves to a market that can’t or won’t give them the price they want for their equity. In other words, they’re covering their assets. (I’ll show myself out.)
In Many Markets, Series A Round Size Peaked in 2014
How does the size of an average Series A round in each of these markets change over time? Here we leave out Indonesia and Italy because, at least in the dataset I used, there is no record of Series A funding activity for certain years. Additionally, in order to compare “apples to apples,” I compare the relative size of Series A funding rounds in each country by normalizing all figures to a score out of 100. If the Series A round size was to remain stable from year to year, each year would have a score of 25 (because we are sampling 4 years of data and 4*25=100%).
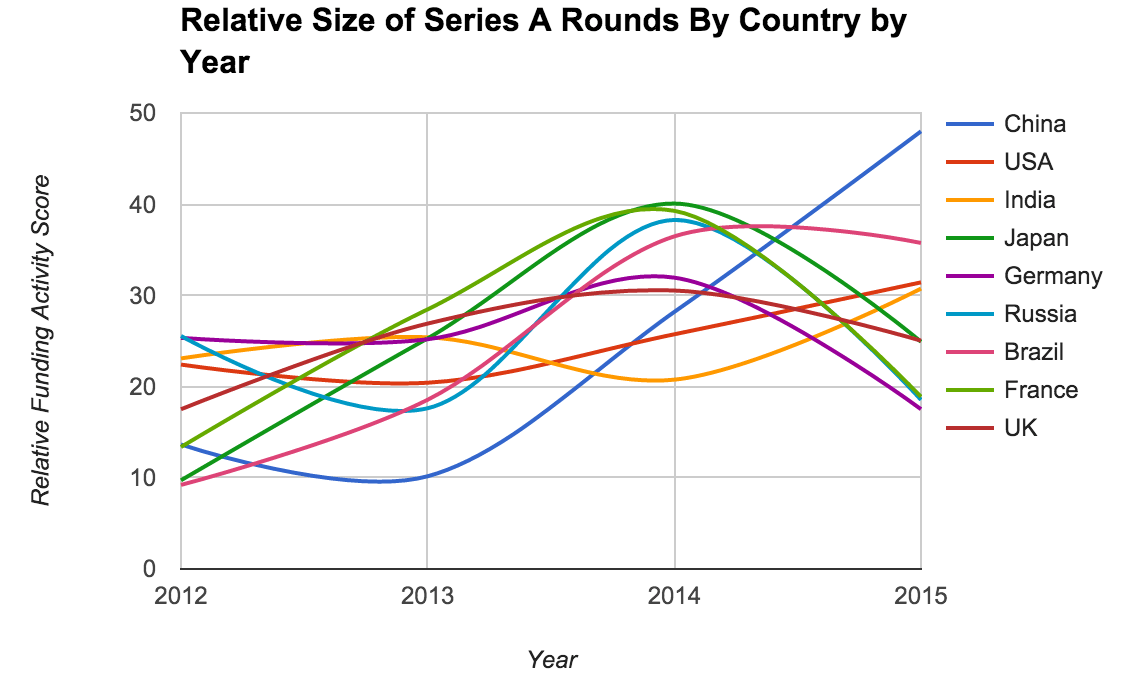
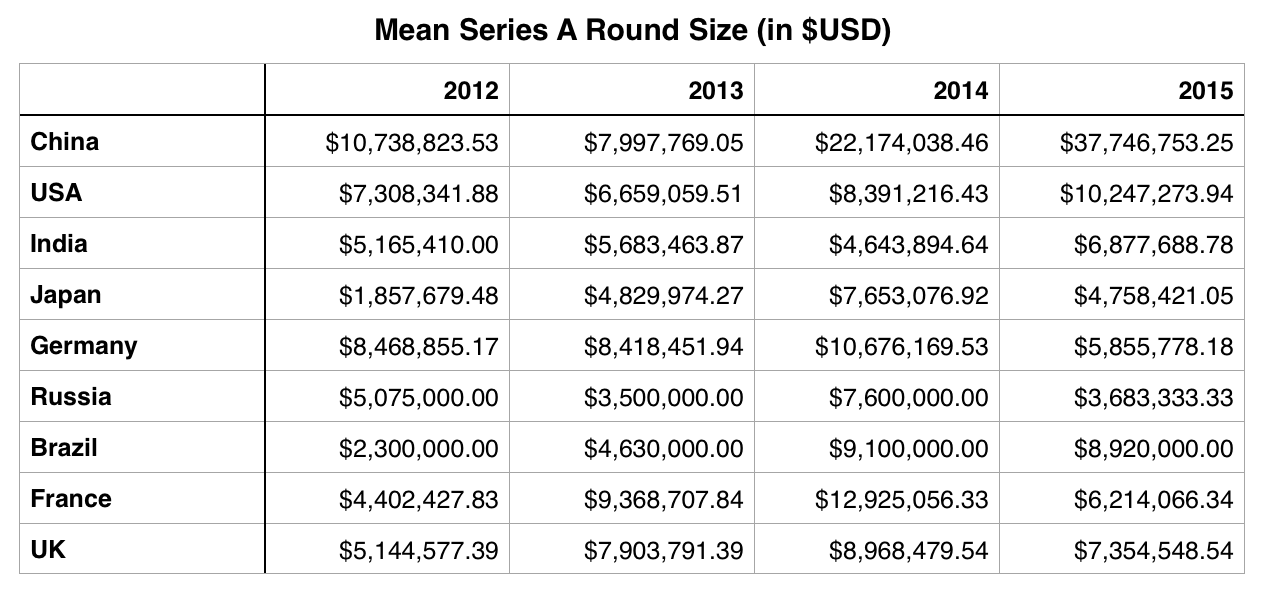
The general upward trend illustrates the growing average size of Series A rounds in all surveyed markets over the past few years. This chart also shows that the average size of Series A deals has steadily increased in China and the United States between 2012 and 2015. Series A deal sizes are also growing in Brazil and India, albeit somewhat less steadily. In the dataset we analyzed, the average Series A deal size peaked in 2014 in many countries, including Japan, Russia, France, Germany and the UK.
For those of you who want to see the table of average Series A rounds by market and year I used to build the chart above, here it is:
The Early Stage “Funding Multiple” is Increasing in Emerging Markets
The data I analyzed suggest there is a lot of variance between the average check size at the Series A round depending on the market. However, interestingly, there appears to be very little variance between average pre-series A funding events in the markets and years we sampled from.
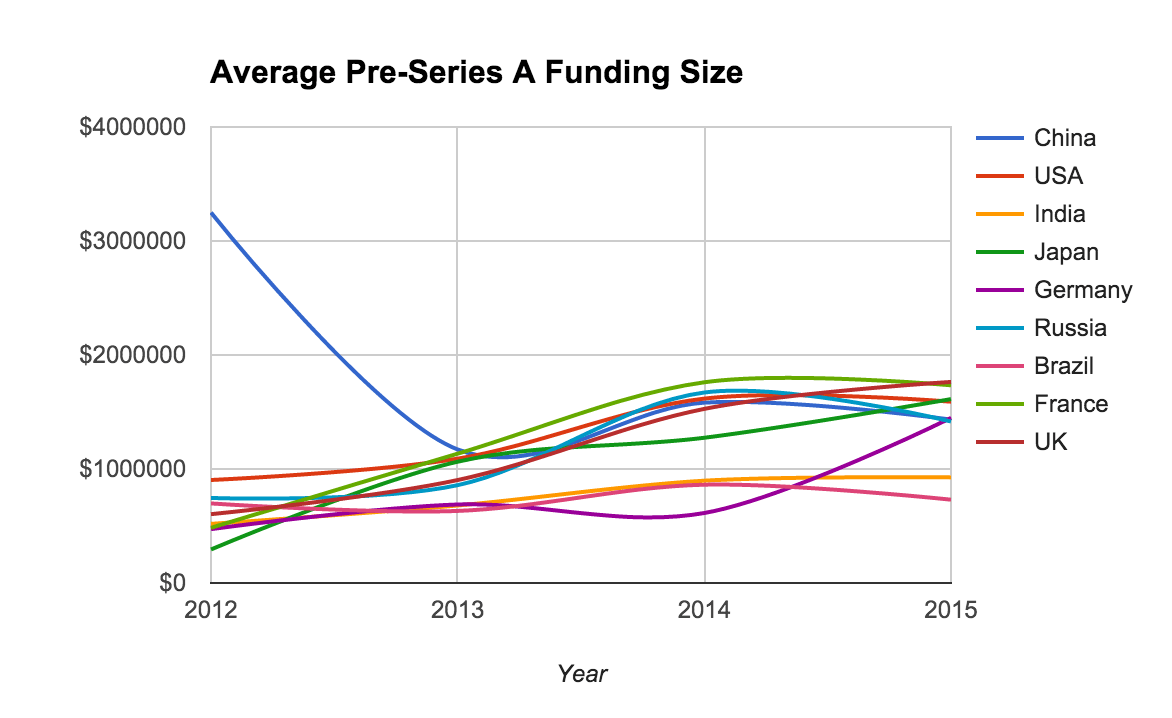
Ruling out the outlying data point from China in 2012, the average Angel and Seed funding event is consistently between $750,000 and $1,750,000, tending toward the higher end of that range for most markets.
However, as I’ve found elsewhere, the average Series A round size varies from market to market, both in aggregate and from year to year. This means that the ratio of money closed during a pre-A round and the A round will vary from market to market over time. For example, in a country where the average Seed or Angel round is $1M and the average Series A round is $10M, the early stage fundraising multiple would be 10x. To find this multiple for each market in each year, we divide the table of Series A average values by the table of Pre-A average values.
Here’s a chart displaying changes in this fundraising multiple over the sample period.
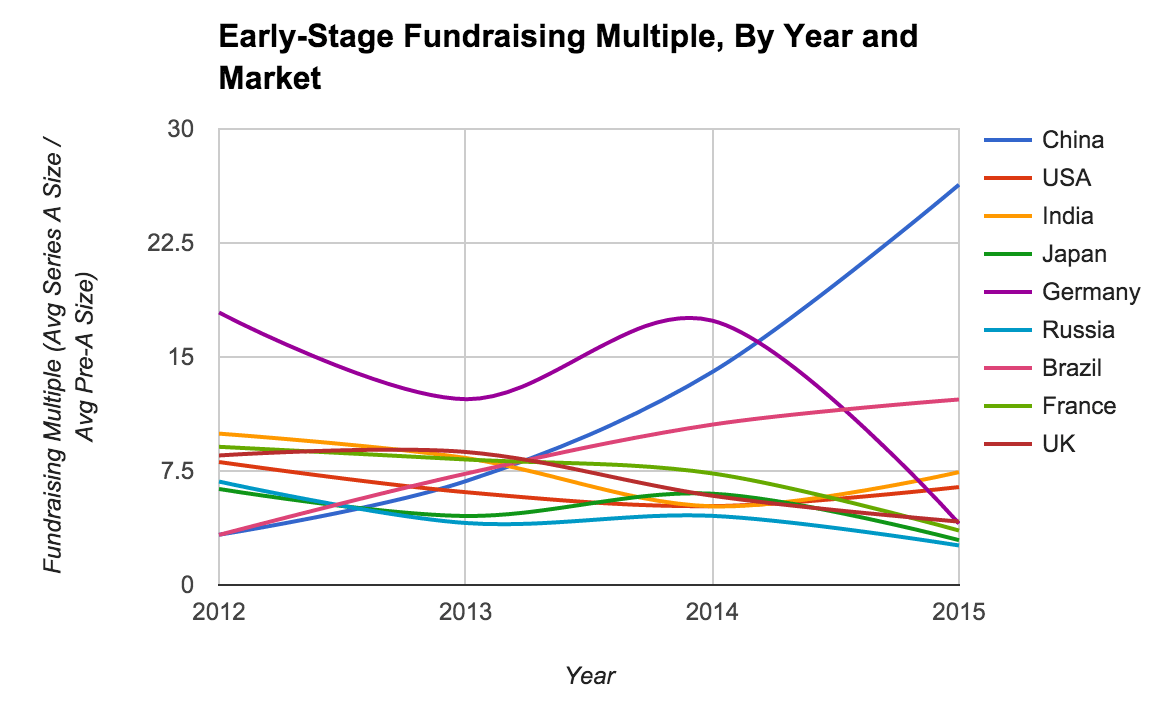
Admittedly, this chart is somewhat puzzling. On the one hand, there are a sufficient number of deals we sampled to say that Germany is something of an outlier, and it’s arguable the dataset I analyzed has too few deals to definitively say that Brazil is an outlier.
Caveats aside, China is unambiguously an outlier. As I showed in the first chart, China’s mean Series A size towers above the USA and others. However, statistically-minded folks out there may say the mean is not the best way to analyze the data.
To that I say in 2015, the median Chinese A round in our sample set is $14,000,000, whereas in the USA the median is $7,000,000. Moving down the GDP rankings a bit, Brazil’s median Series A was a comparatively paltry $3,000,000, despite the fact that Brazil’s per-capita PPP-adjusted GDP, ~$11,200 according to most recent World Bank figures, is nearly twice China’s overall per capita GDP of ~$6200. Even when comparing per-capita GDPs, China’s hottest startup markets—Shanghai and Beijing—have per-capita GDP’s around $12,700 as of 2011. Given the rapid growth of those cities, that figure is no doubt higher now, but certainly not high enough to account for a ~4x gap in round size. So whatever is driving such high demand for equity in early-stage startups in China is probably not a function of GDP.
What Does This Mean?
One investor I spoke with suggested that, in investment markets that haven’t yet reached maturity, one might expect to see the average round size increase for a given asset class (like equity in Series A-stage startups) as institutional money moves “down the ladder.” In other words, as investors with very deep pockets begin seeing opportunity to invest in younger and younger companies, they will invest in those companies and thus raise the average amount raised in a given round. To mix a couple of metaphors here: a rising tide may raise all ships, but so does a whale diving into your pool.
Basically, if a big institutional investor suddenly enters an emerging but still largely untapped startup ecosystem, one would expect to see the average round size to grow in that ecosystem. We can see that happening in countries like Brazil, India, China and other countries in the sample, especially when later fundraising stages are taken into account. At a more micro-level this can also be seen in emerging startup cities in the US and abroad.
There are also a lot of stories that can’t really be told well given the (wide) scope of my analysis, like how many of the fastest growing companies in the world (such as Flipkart, Ola, Snapdeal and Delhivery) are headquartered in India. Or that, for having such a large economy, Indonesia’s startup scene is either disproportionately weak or undeservedly underrepresented in the dataset I analyzed. Also, Brazil and other South American countries have seen a lot of investment interest from prominent US investors in spite of economic uncertainty. And France and Germany are quietly leading a science-based startup boom. However, it can be said, based on the data, that China is probably the most enthusiastic market for early-stage startup investment in the world right now. Whether this exuberance is rational or not will probably be decided in the next year or two.
Conclusions & A Call For Questions
At least in terms of early-stage funding, 2014 was the last true banner year for most markets. 2015, while seeing a decline in average round sizes at Series A, also saw an explosion in interest in late-stage funding. Does this mean venture investors are trying to de-risk their investing strategies? Are they simply reaping the gains on risk equity they sowed a few years ago, holding off on new investment because they see winter coming?
Maybe. Or investors are getting smarter about the bets they make, at least in most countries, notwithstanding China and the USA. Round size is not the end-all-be-all of startup economic analysis, but especially at the earliest stages, it’s a rough proxy for risk appetite and a signal for the kind of capital committed to growing companies as they find their footing and become less risky.
As much fun as it is to analyze startup investment activity through the lenses of large datasets (such as Mattermark’s) and GDP rankings, this latter lens by definition biases economies that are already large. I’m convinced that there are countries—heck, even whole continents, like Africa—that didn’t make it into my radar for this post. For those of you who made it this far, I’m openly soliciting research questions for more analytical deep-dives, but this time I want to report with a more regional, industry-specific, or econometric focus.
I can be reached on Twitter at @Jason_Rowley.