Editor’s Morning Note: Apple and Microsoft have more than divergent histories, they have conflicting charts!
There’s no shortage of high-quality Apple-focused photography on Unsplash.
It’s going to be a busy week. We’re in the middle of an earnings cycle, a company that sells consumers shared access to residential copper wants to buy HBO, and it’s cold in San Francisco.
With all that in mind, we are going to start things off slowly, granting our brains time to adjust.
Today, we’re looking at two charts that show off the historical growth of two companies near and dear to the both of us, at least in terms of products that we use. Hello, historical Apple and Microsoft.
Dueling Market Caps
Quickly, Apple and Microsoft have a fraught history with one another. Even financially, thankfully, as that’s our forte.
Back when money wasn’t free and snapchatting involved postage, Microsoft invested $150 million into Apple.1 After that, Apple had a few pretty good decades. It invented new product categories, eventually fusing its mobile music work and related learnings into a new smartphone that kicked off the app revolution. Cupertino eventually ceded the lower end of the market, keeping the lion’s share of profits to itself in the process.
Before it all shook out that Apple had become the king of mobile products, Microsoft lost billions on a European hardware manufacturer that it had previously propped up financially, and Google itself lost a few billion bucks buying Motorola. Both are, oddly, still in the smartphone business, and a key Google partner accidentally shipped smartphones that exploded this year, putting Google latest in-house attempt at a smartphone up on a — fuck it, you get the picture.
The gist is that Microsoft and Apple have had long, complex, and interesting histories. Given their lifespan, their stories are, in many ways, the prose of Silicon Valley.
Now, let’s tell our tale. 
Seriously, at all.
Charts
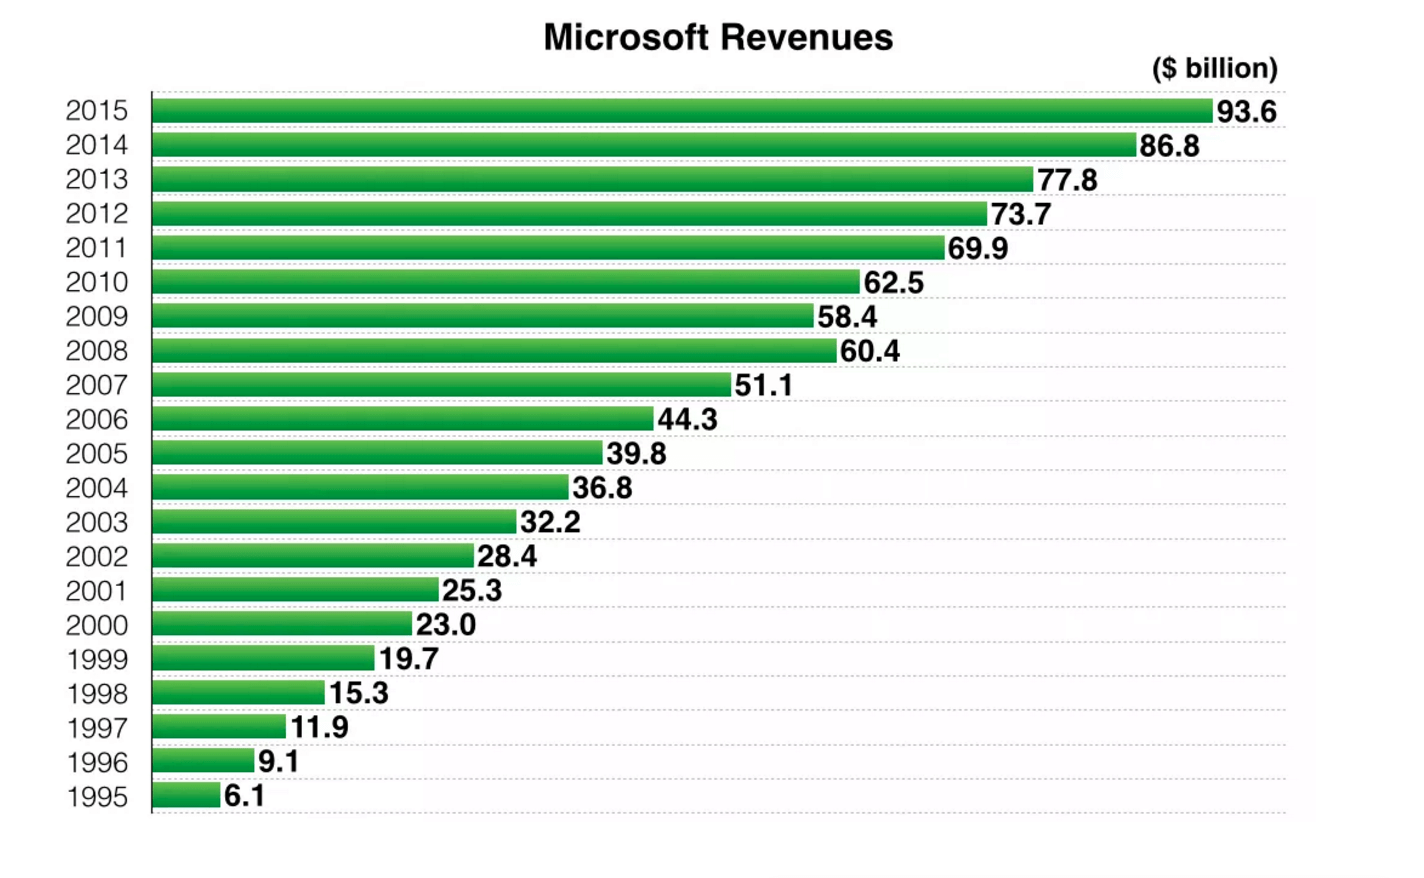
The excellent humans over at Revenue and Profits produced a number of charts and graphs comparing the last few decades of financial result from Apple and Microsoft.
We’ll start with revenue. Here’s Microsoft’s chart, through 2015, showing a very steady, linear growth curve:
Simple enough. Now, observe how it varies from Apple’s equivalent chart:
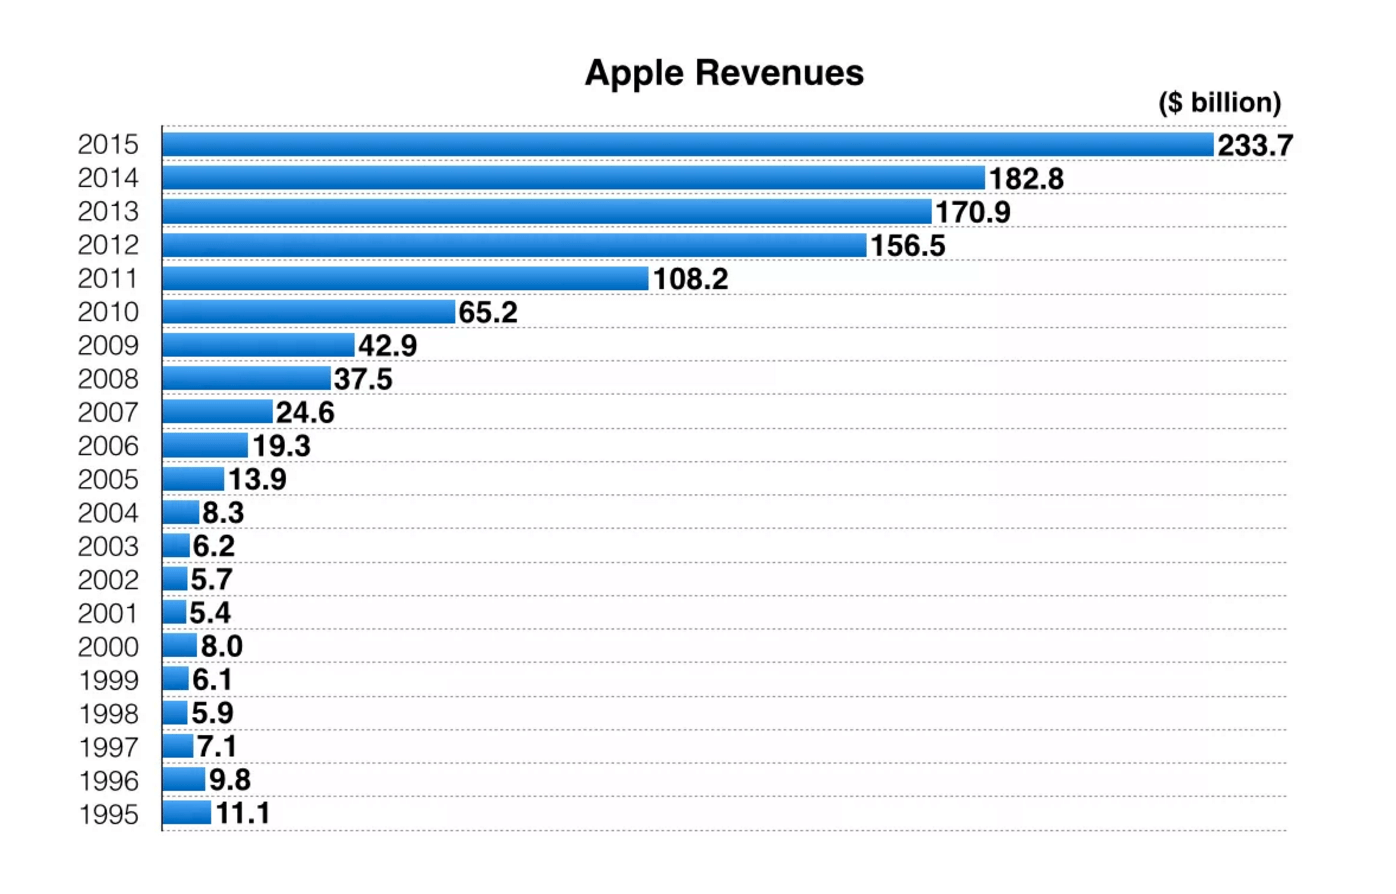
See the difference? Apple’s bars form a sort of top line slingshot, accelerating over time from the mid-2000s through to last year. In fact, for fun, check the 2005 and 2015 result. Apple had a bit of growth during that decade.

Ok this one is a bit out of date. Look at how thick that Macbook Pro is!
There are a few lessons to source from the above charts. The most important lesson from Apple’s chart is that a few revolutionary products can put you on top, provided you have the execution capability to stomach hyper-growth of that sort. Microsoft’s chart shows that business revenue can grow on a nearly unsettlingly steady path, even without recurring revenues as a majority of income.
But there’s more.

It’s what we thought the future would look like back when we thought we’d have hoverboards by now.
The full post is worth your time, but we’ll lean on its authors’ patience again by sharing just one more chart. This image shows why Apple is worth so very, very much. Observe when Apple’s margin improvement march began, and when its revenue took off in its prior chart:
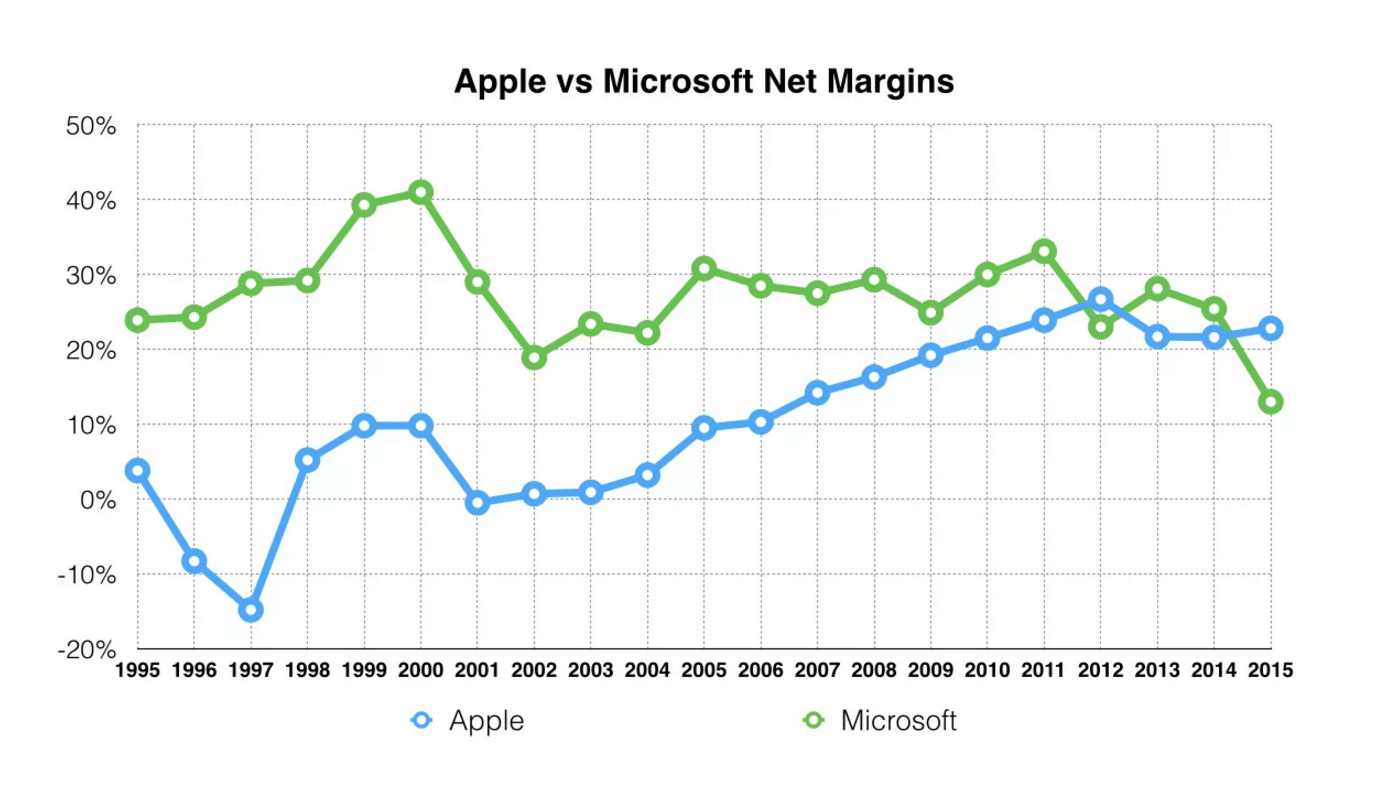
When you can expand your bottom line while dramatically growing your revenue at the same time, you tend to accrete some market cap. And Apple did just that.
- This is akin to Trump donating to the Sanders campaign for president in early 2016. Only the political example here is hypothetical, however.