This post is part of our Startup Funding Benchmarking Series exploring the allocation, concentration, and macro trends in the financing of high growth startups.
Yesterday we published an analysis of year-over-year comparison of median VC funding round sizes by stage, revealing what many investors already know: round sizes are up significantly since July 2014, corresponding with an increase in private company valuations. We observed a “barbell effect” where late stage and Series A deal sizes have seen the most movement, and today’s analysis digs into Series A deal sizes from the beginning of 2008 to present.
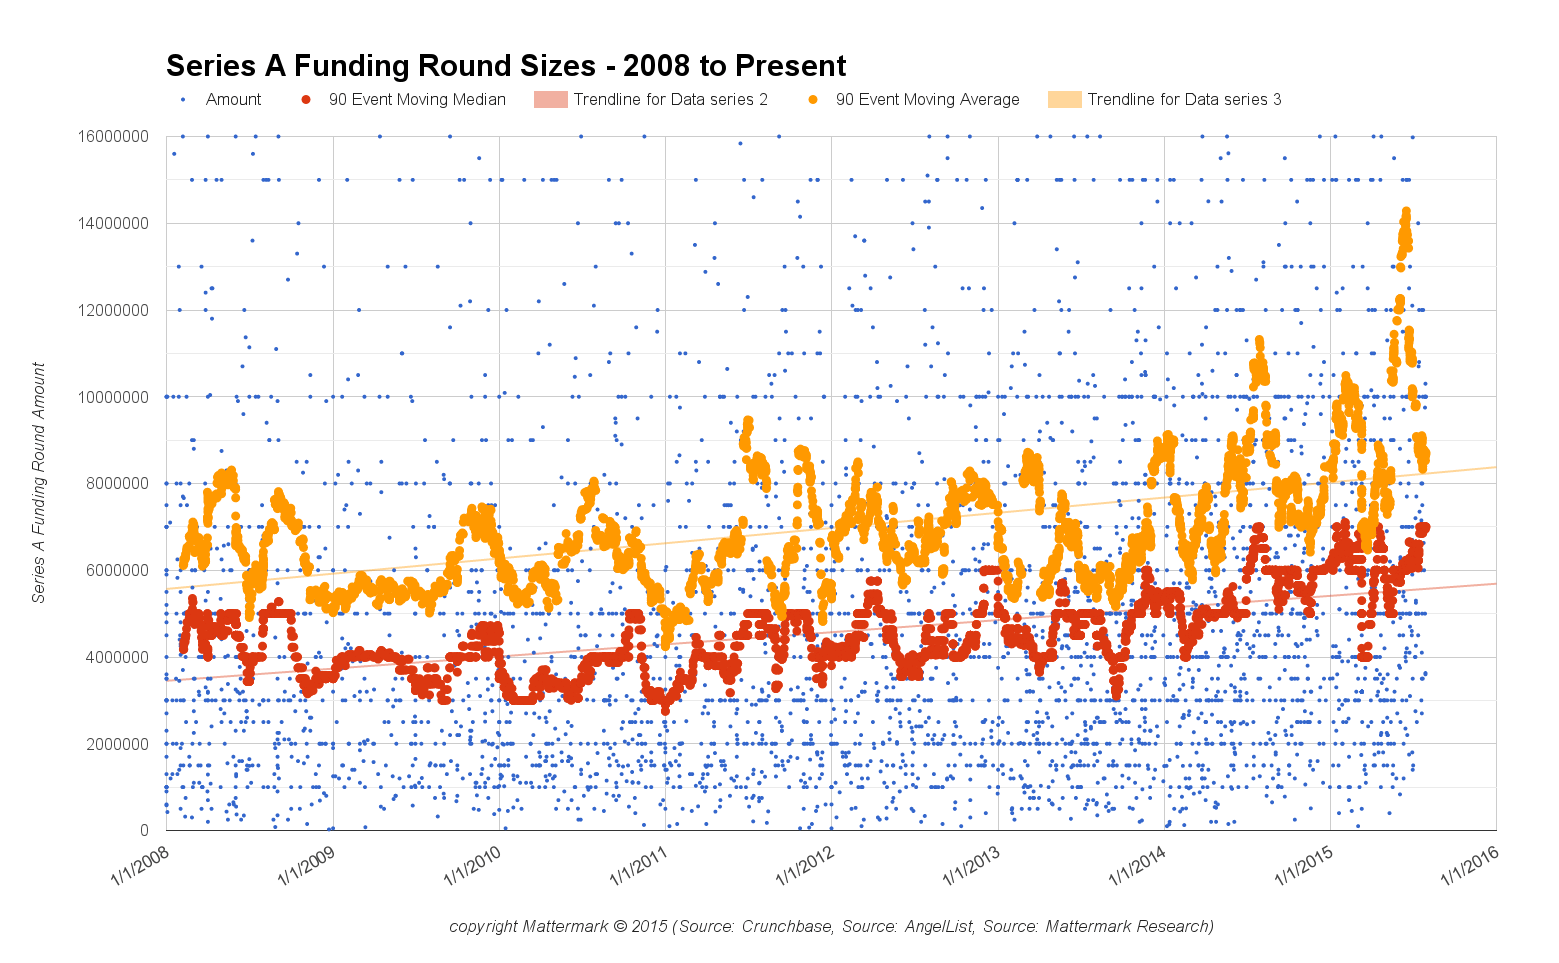
Looking at the graph, we observe that the average round size is always significantly higher than the median. The average peaked in mid June of 2015, where 33 of the past 90 Series A round sizes were recorded at $10 million or greater. Over the entire period, the median round size for a Series A has increased by $2.8 million, from $4.2 million in early 2008 to $7 million at the end of July 2015.
This 68% increase since 2008 has not occurred steadily, and may simply lag broader market conditions such as the ongoing impact of The Great Recession in late 2009 and 2010.
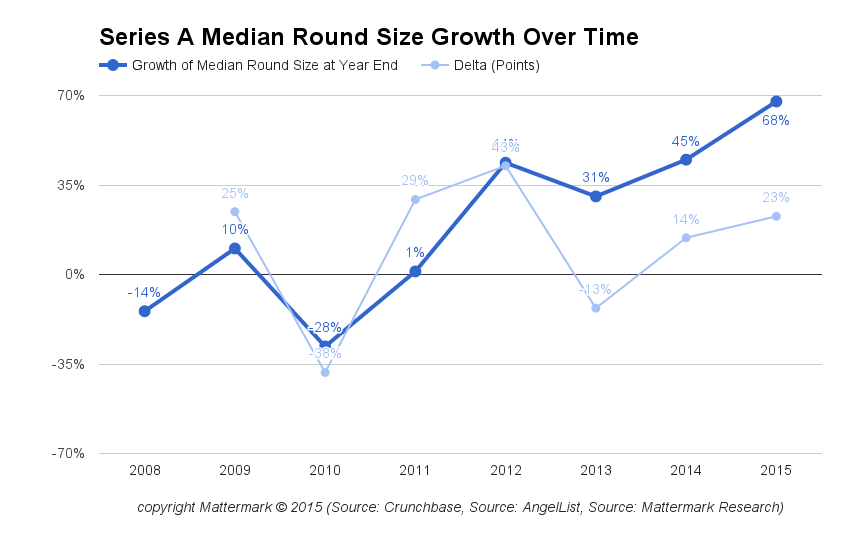
2011 ended the year with median round sizes up just 1% from their 2008 level, in concert with a broader economic recovery, and 2012 continued on this positive momentum with the single largest jump in round sizes of the past 8 years.
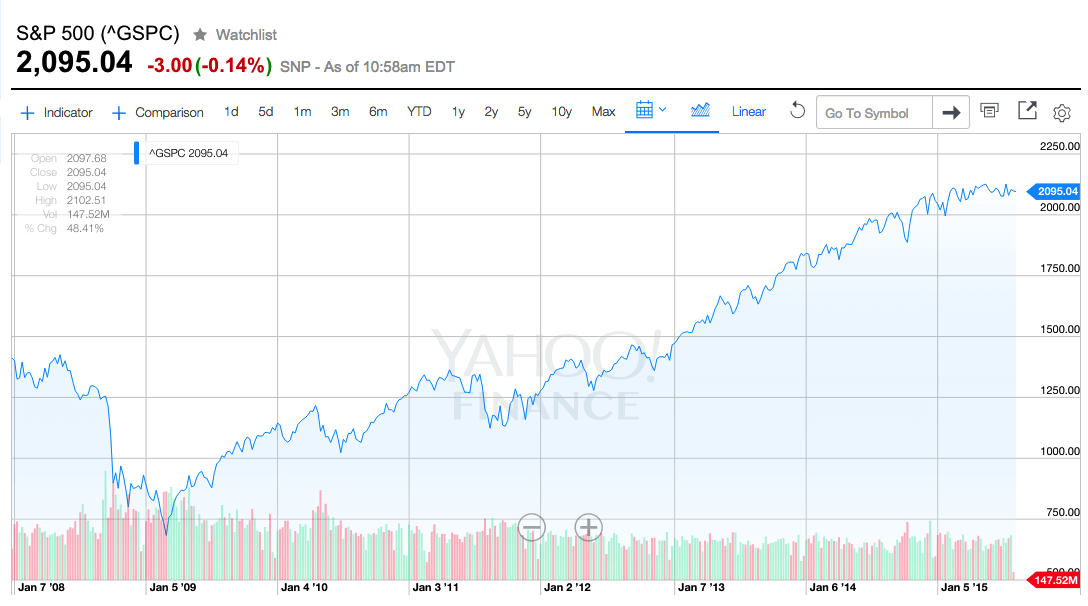
Source: Yahoo Finance
Savvy readers know that demonstrating a relationship between two trends does not prove that one series of events caused the other, so while we observe an increase in prices in tandem with an increase in broader economic growth it is important to consider other factors. Are the hurdles for raising a Series A round higher than they were in 2008? How has the volume of deal activity, and competition for those deals across a larger number of early stage funds, effected pricing? What other signals might we use to understand this trend? Stay tuned to our Startup Funding Benchmarking Series as we continue to explore these questions through data.
Methodology Note: In Graph 1 we present “90 Event Moving Average” and “90 Event Moving Median” measurements, which takes the average or median respectively of the past 90 funding events announced in chronological order. You may be familiar with measures such as a 90 *day* moving average, and we would like readers to note this difference. This was done for ease of analysis, and we believe it presents a meaningful set of information to inform against this trend.
Looking for resources to help you research startups and venture capital? Sign up for a free trial of Mattermark Professional to access the underlying data for these graphs, as well as in-depth profiles of more than one million high growth companies.